.gif)
Pennsylvania, PolarizedHow a blue wave and red response deepened the state’s political divisions
Pennsylvania is a state divided.
That was made strikingly clear last November. Most people think they know the story of that midterm election, as Democrats rode a “blue wave” to convincing victories. But at the same time, a less-noticed opposing force — a red response — solidified the Republican base in rural areas.
An analysis of returns from the state’s more than 9,000 precincts in 2018, recently available for the first time, along with other data from previous elections, shows an acceleration of the years-long trend of Pennsylvania voters pulling apart from each other, separating into partisan camps along visible geographic divides.
The resulting portrait: Urban areas are the core of the Democratic base, but their adjacent suburbs are becoming a wider extension of that bastion, while already-Republican rural areas are shifting further to the right.
And as the fissures deepen, they have the potential to worsen gridlock in Harrisburg and shape battleground Pennsylvania’s role in the 2020 elections and beyond.
There may have always been a Red Pennsylvania and a Blue Pennsylvania. But they didn’t always look like this.
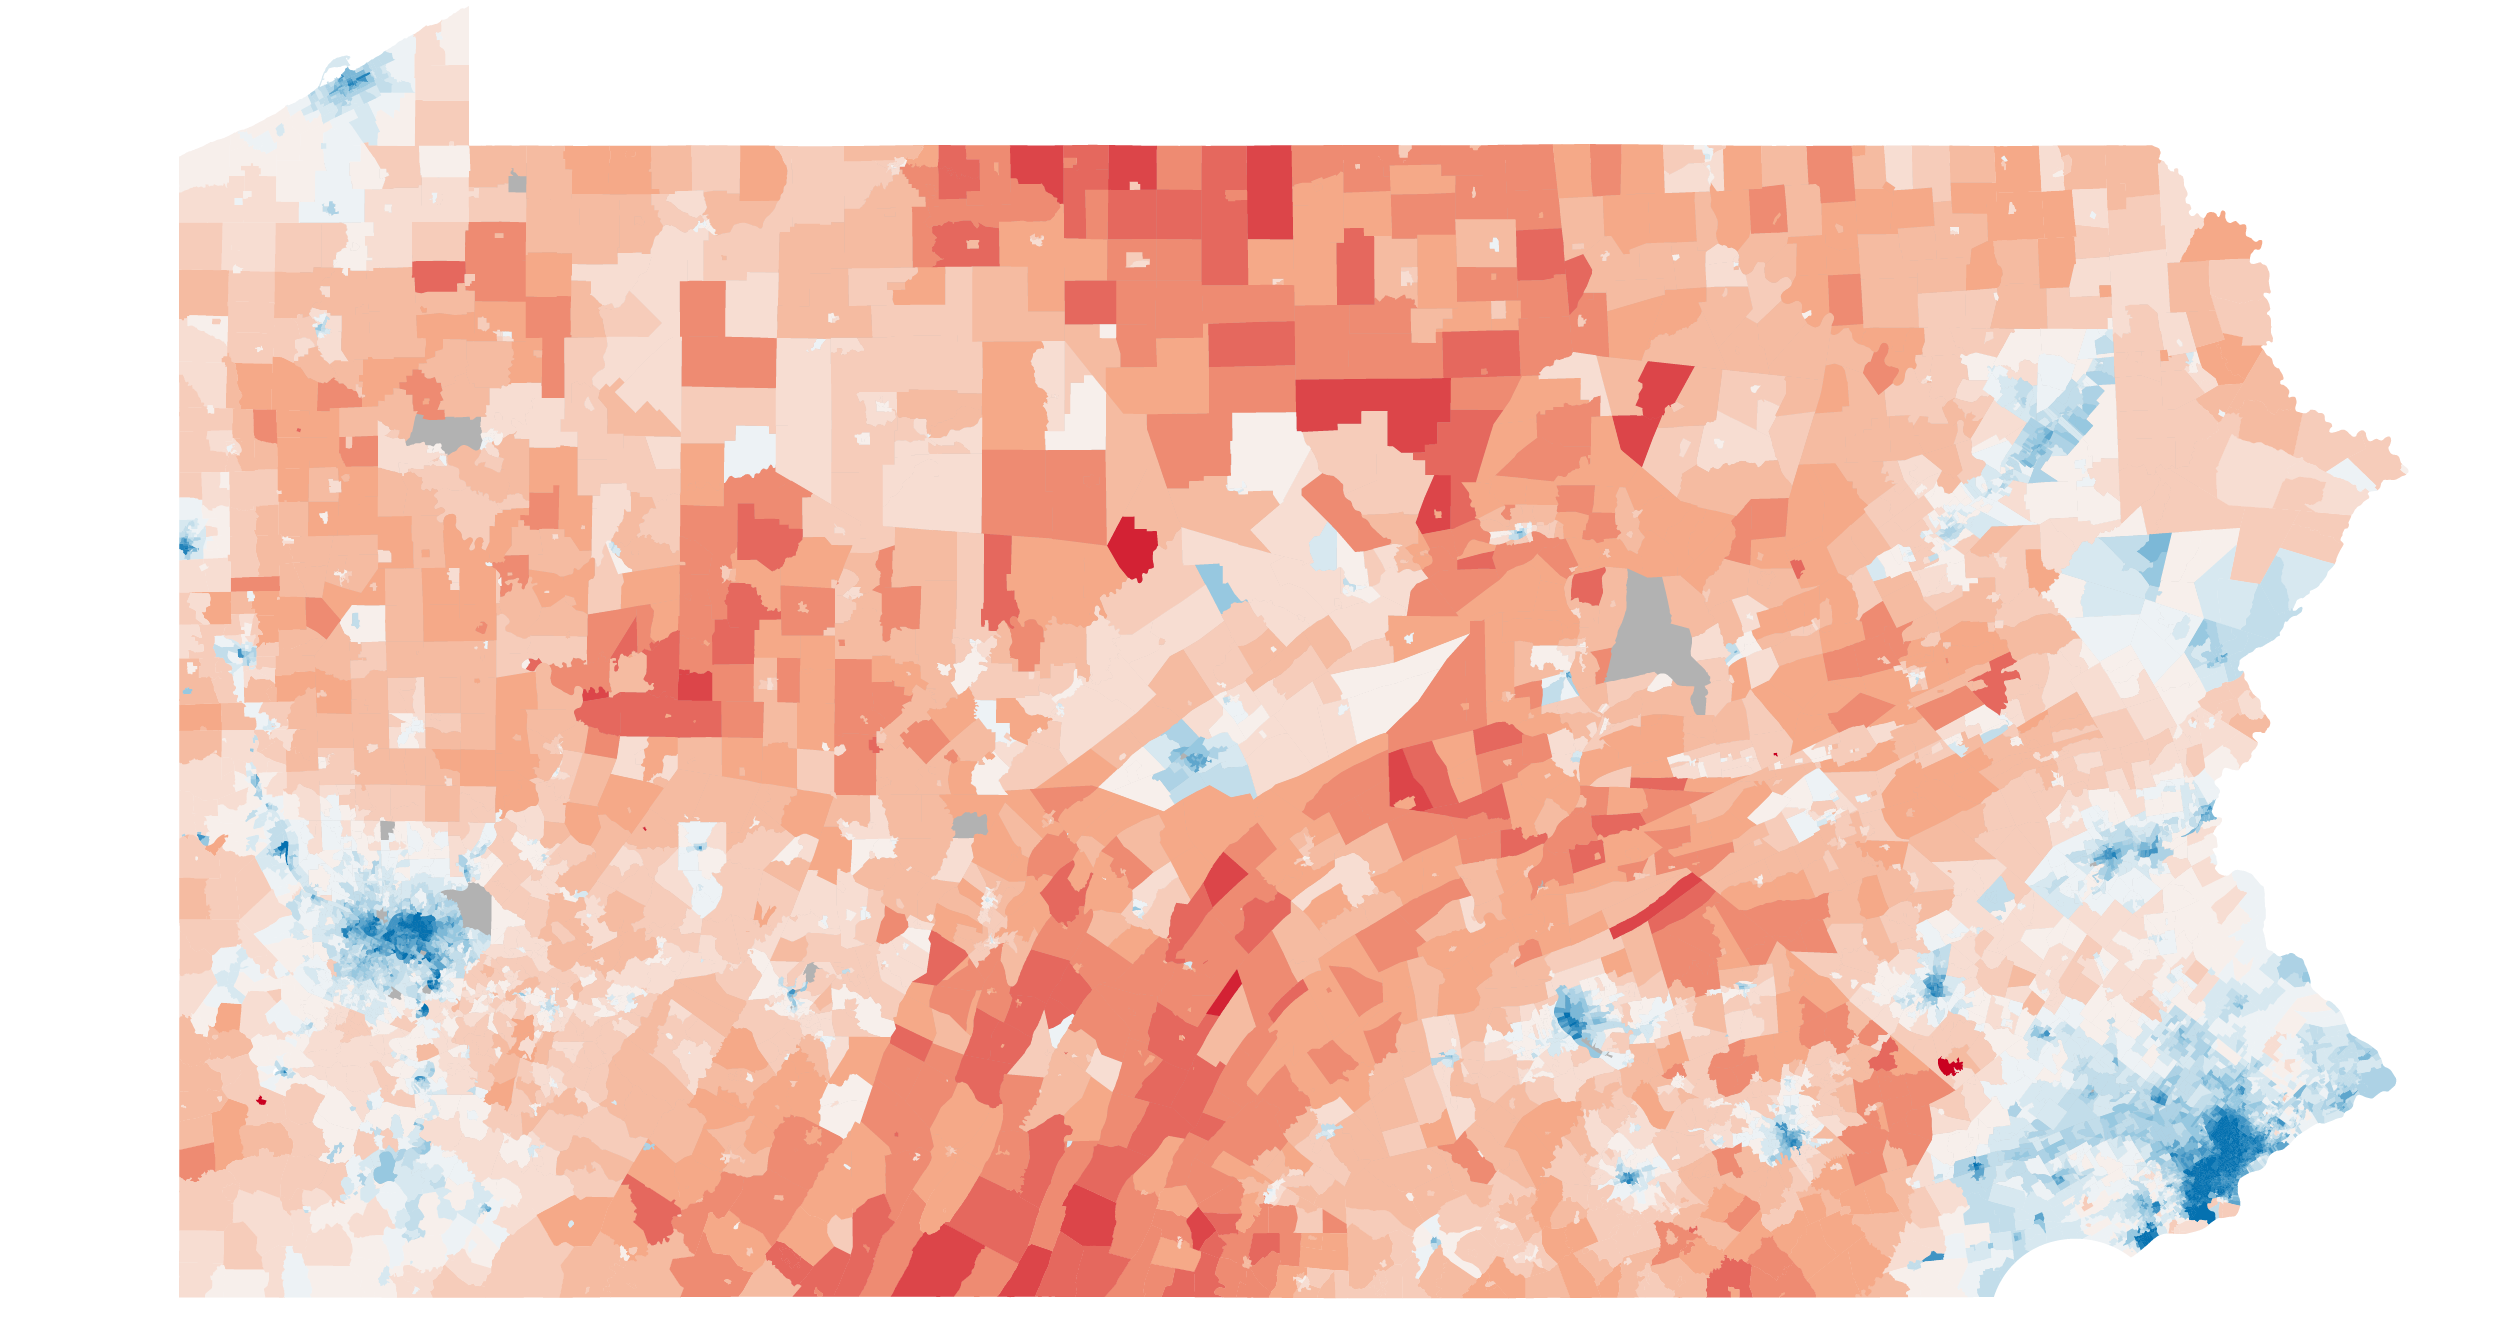
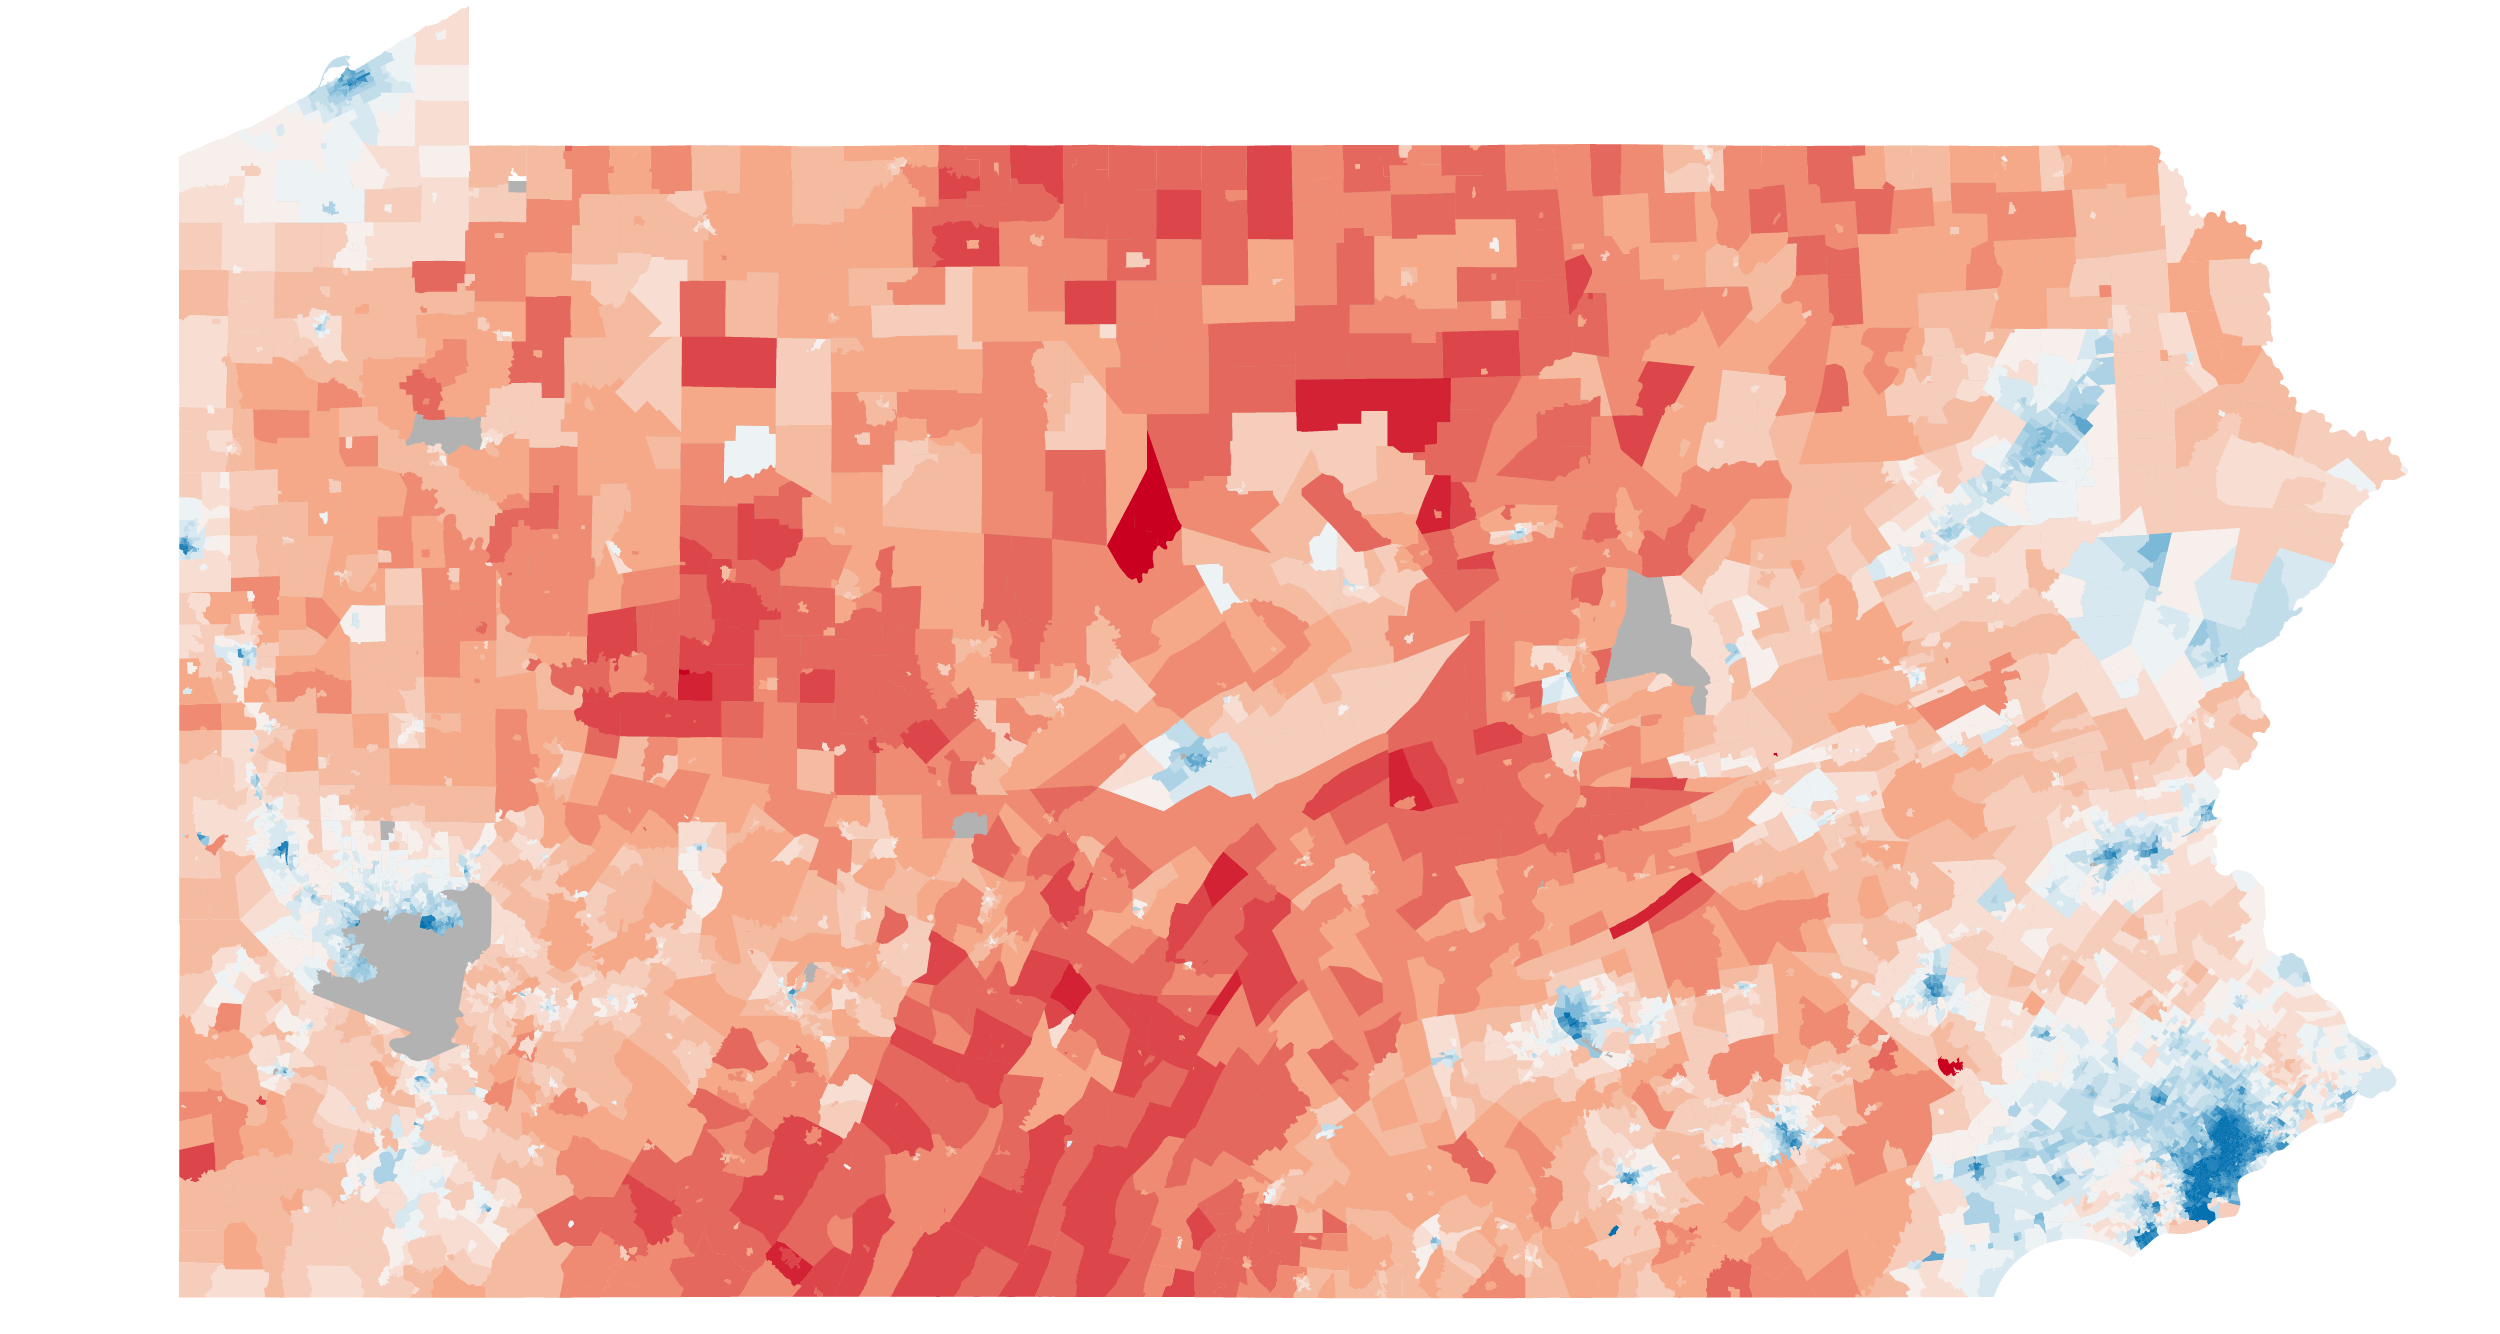
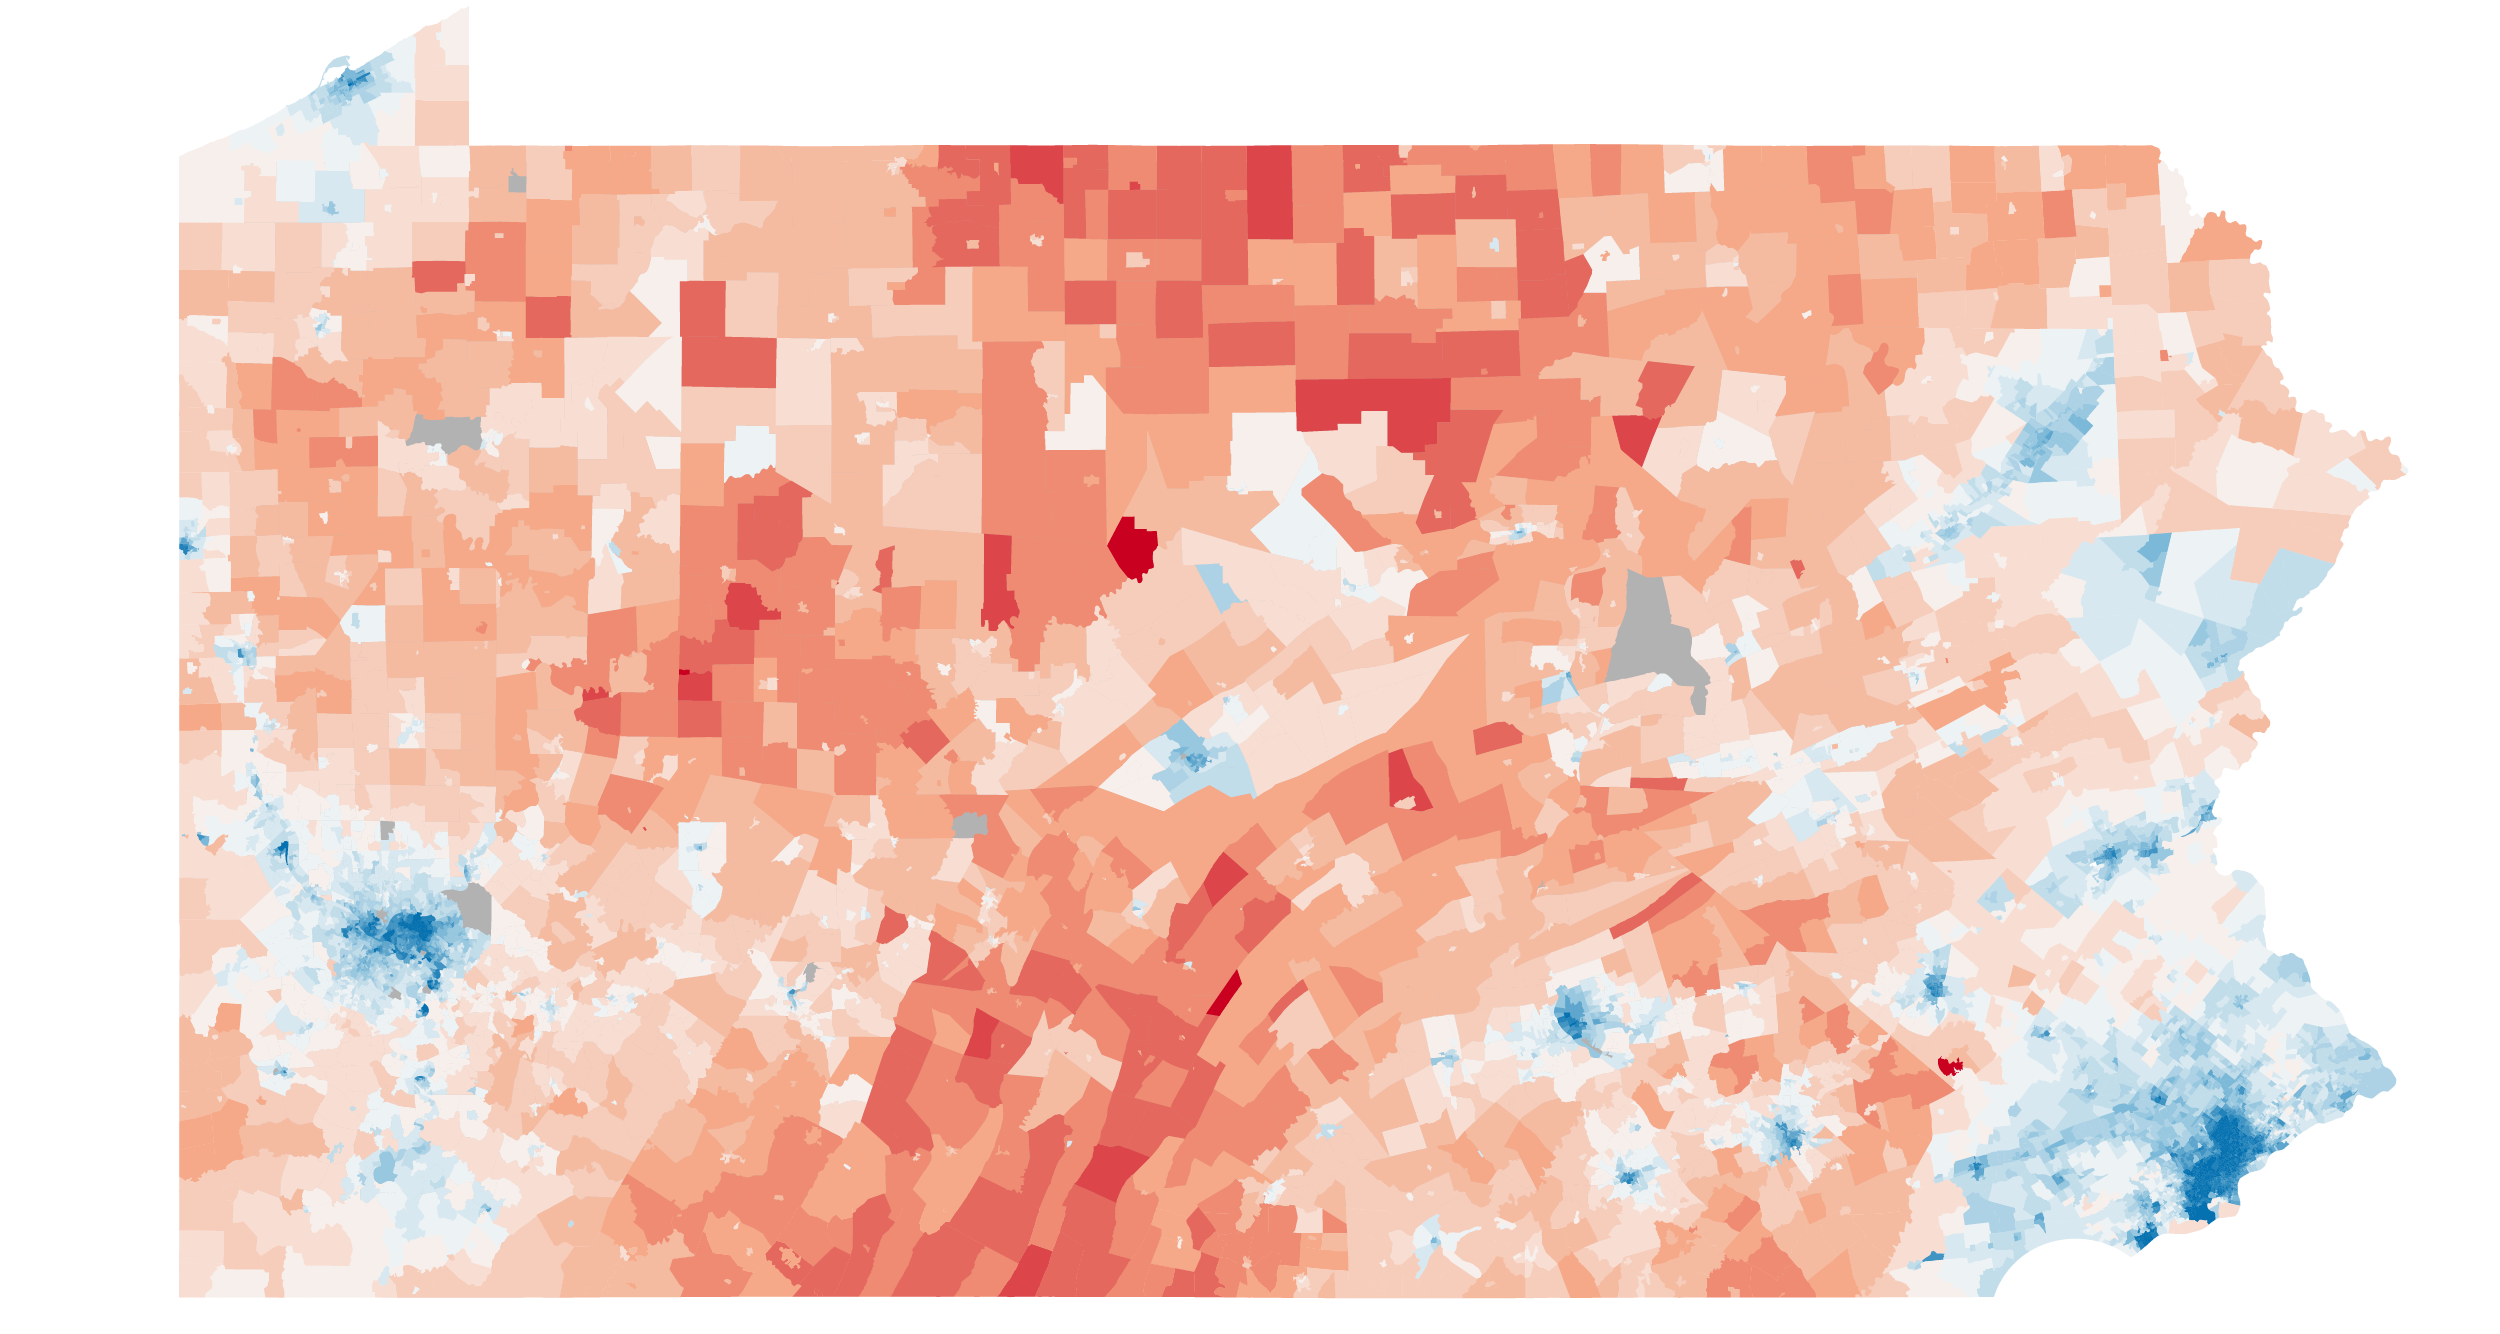

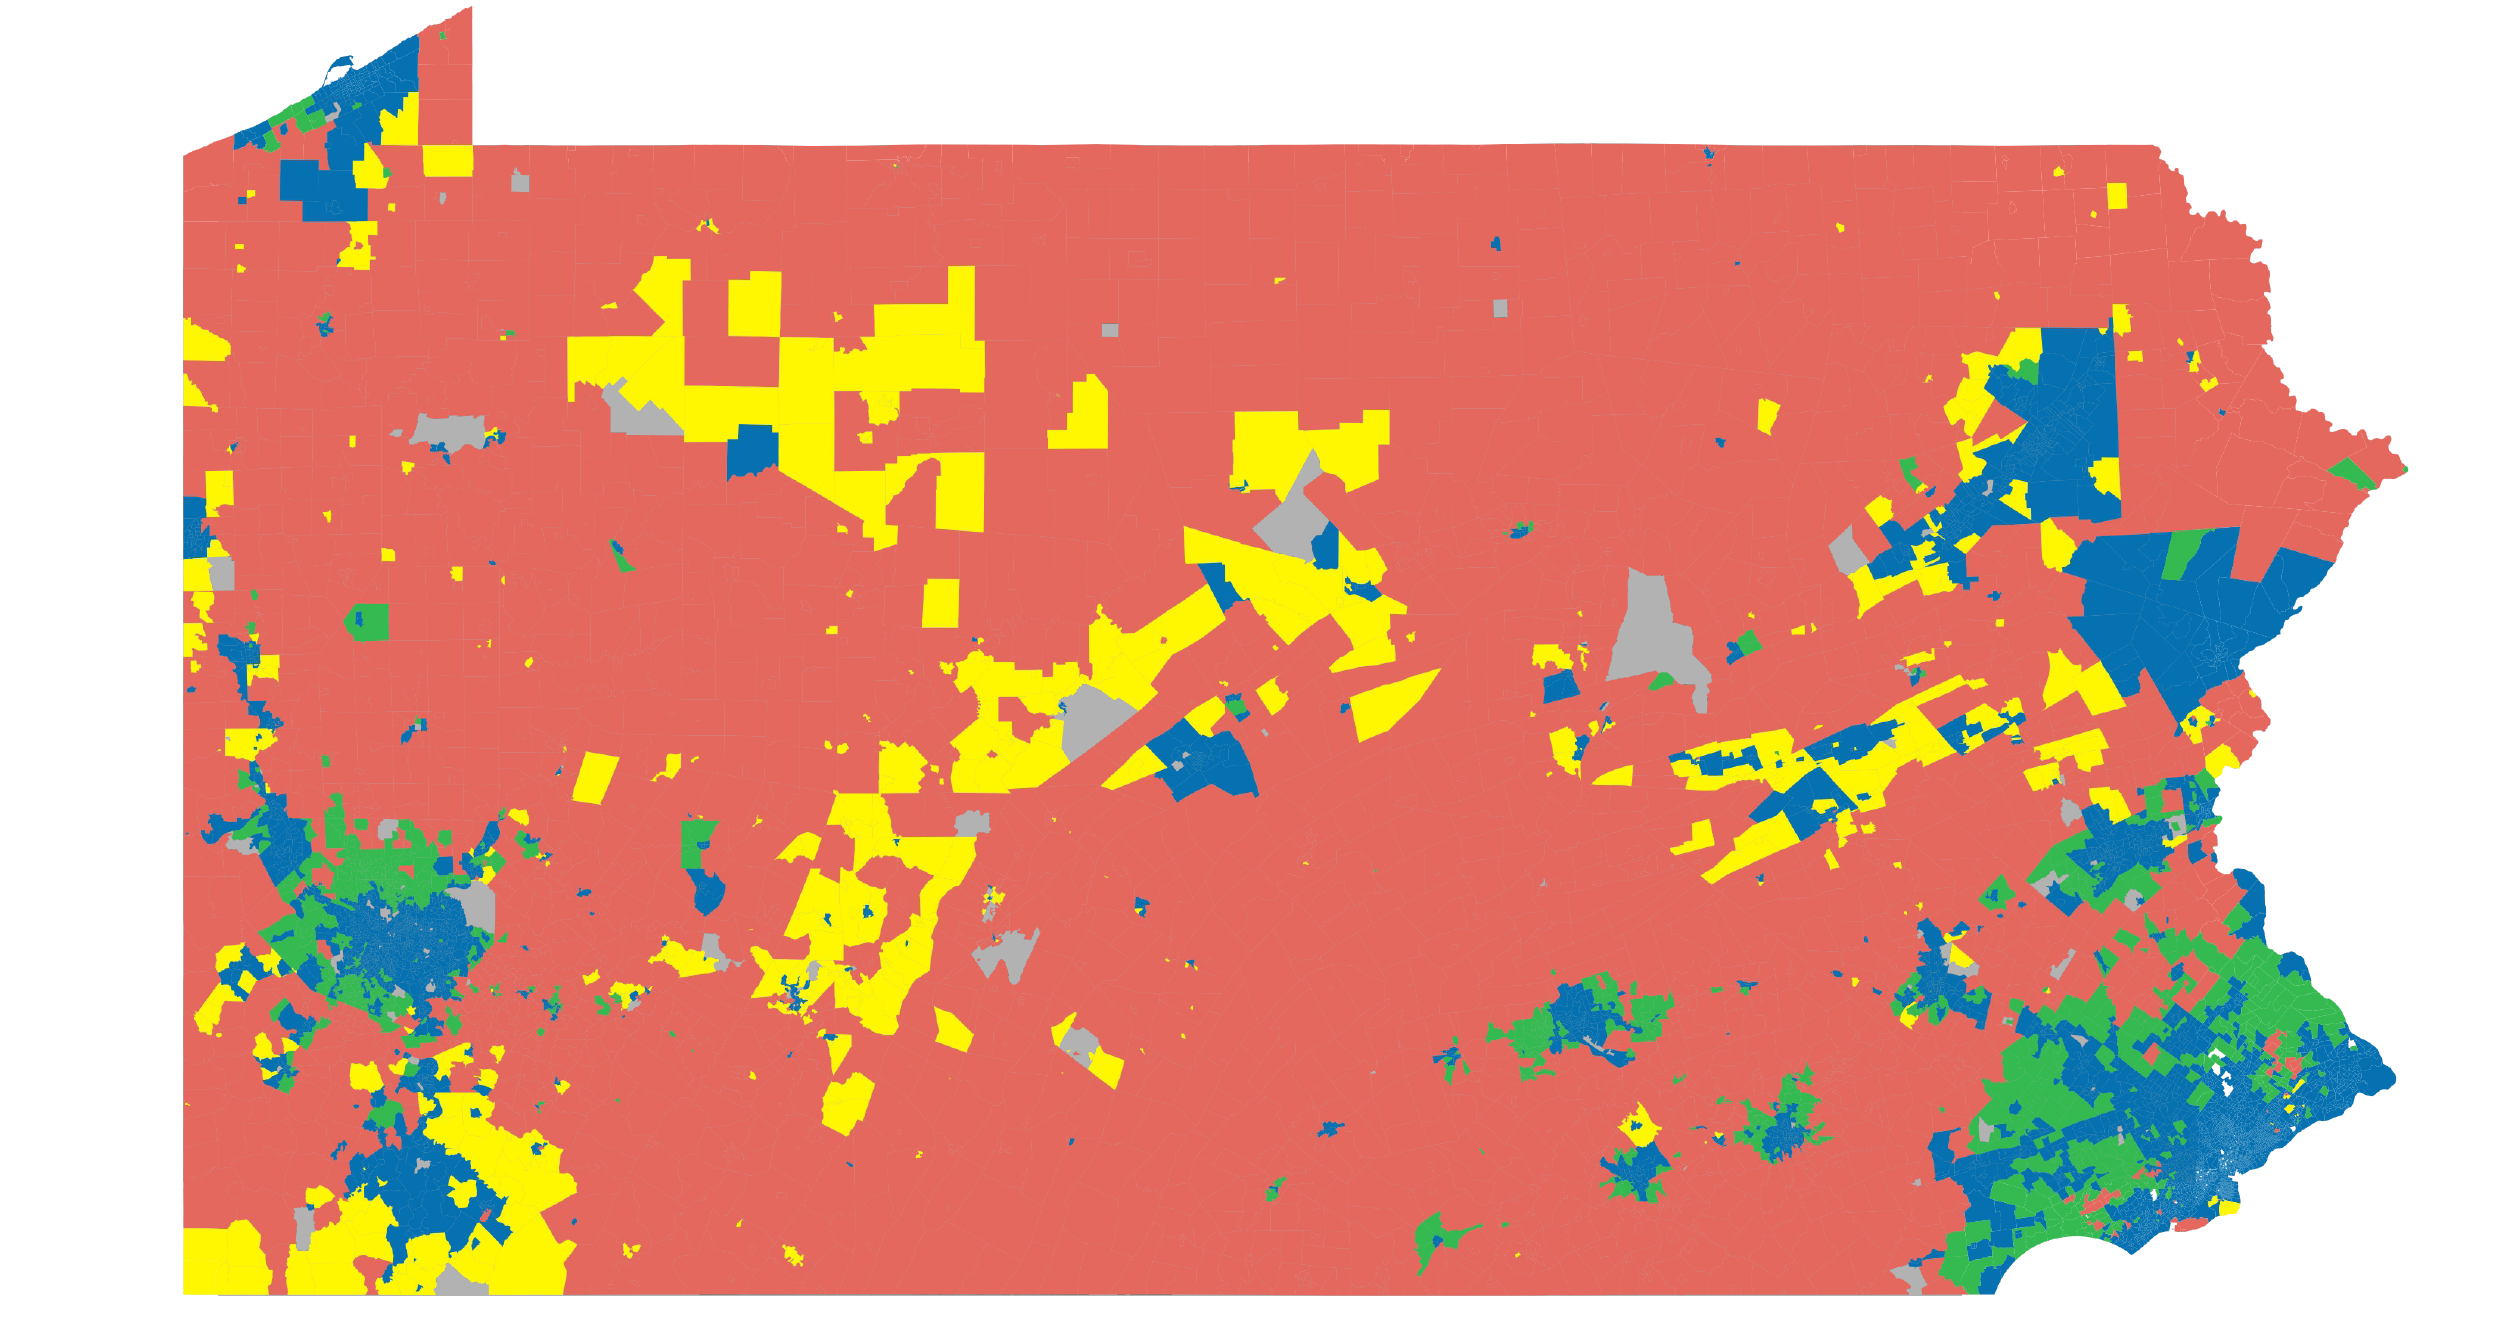
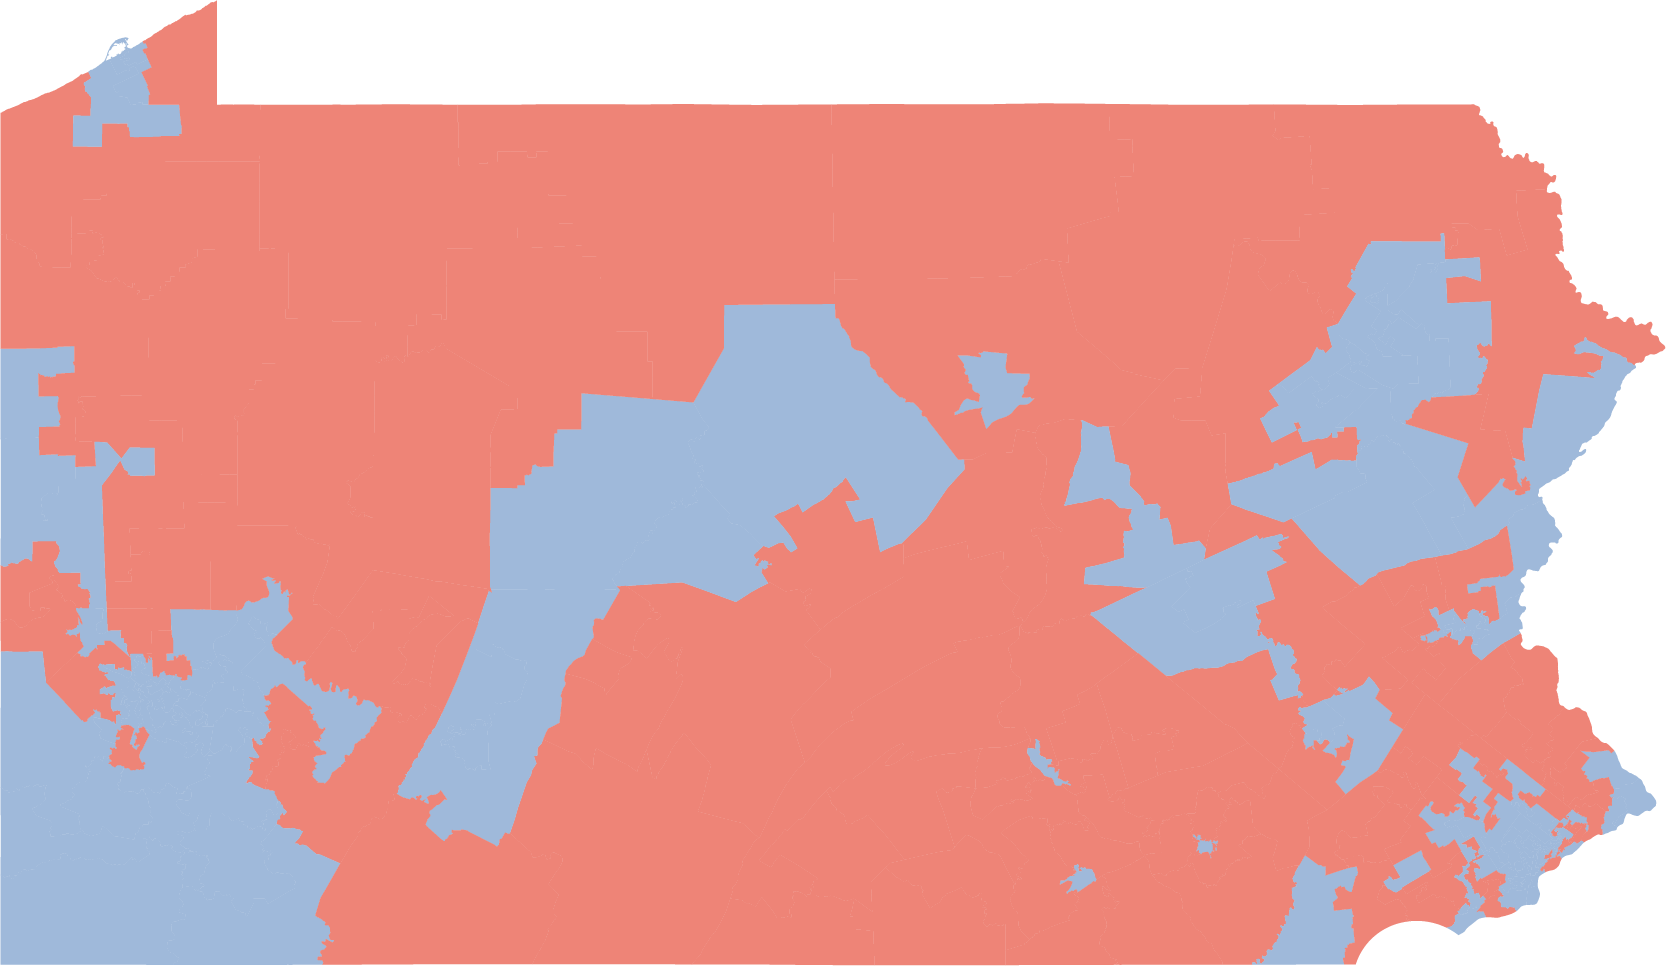
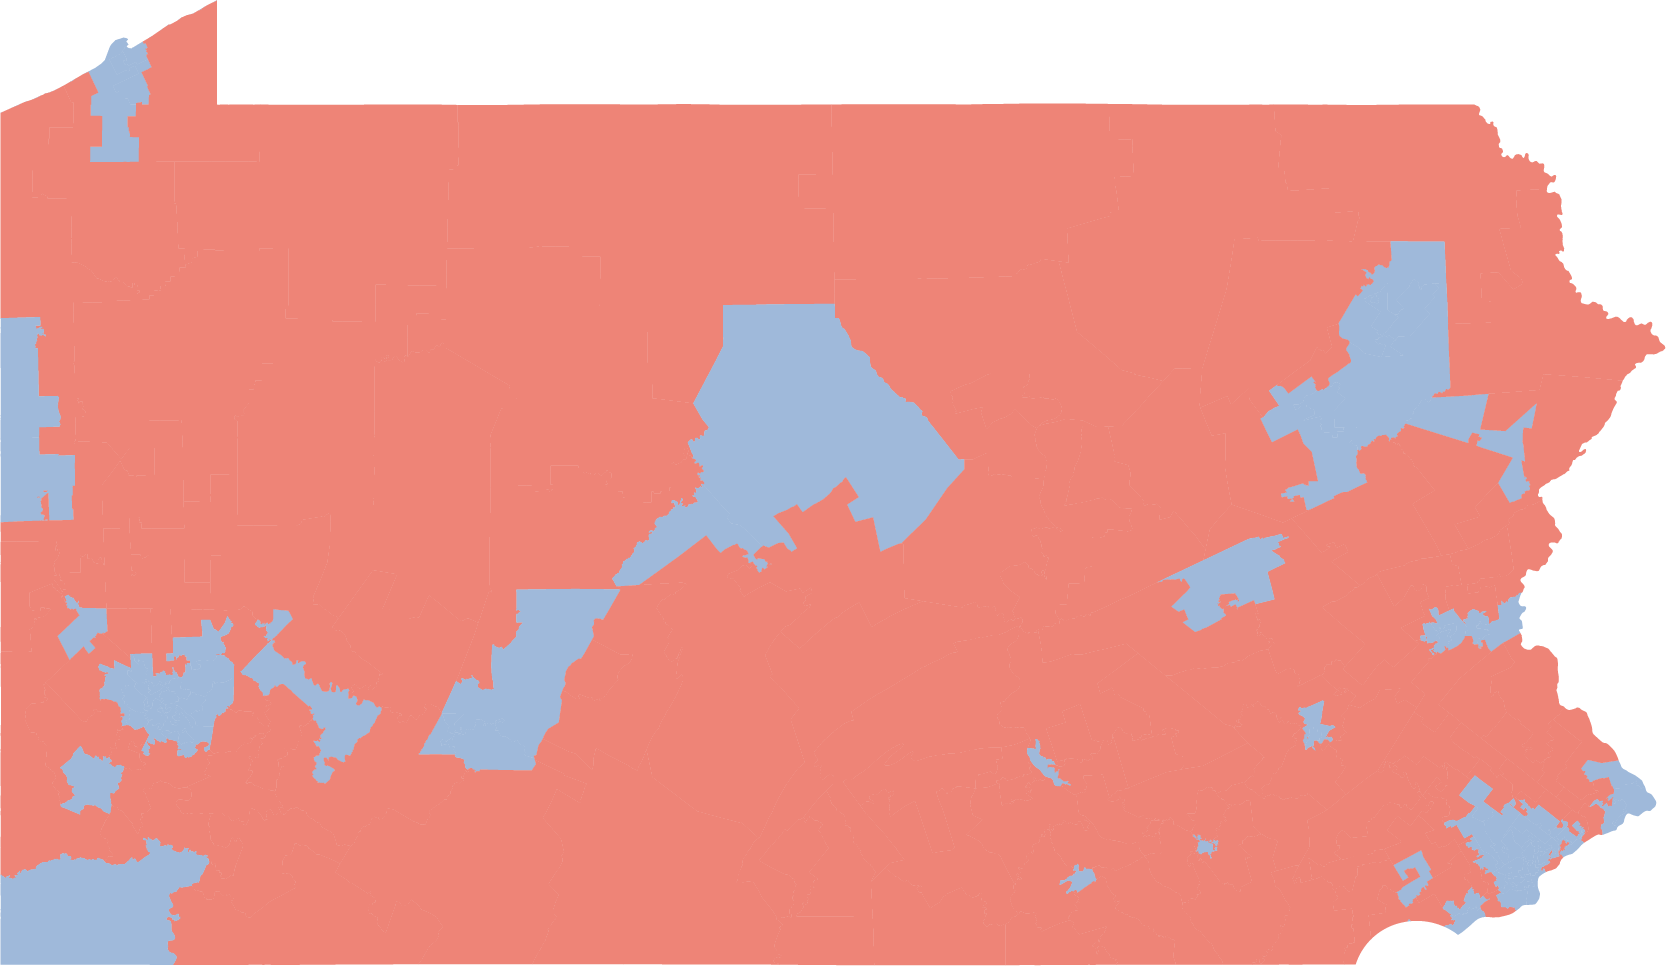
The state’s division is clear in the 2018 U.S. Senate race results, with blue in cities and suburbs and red in rural areas.
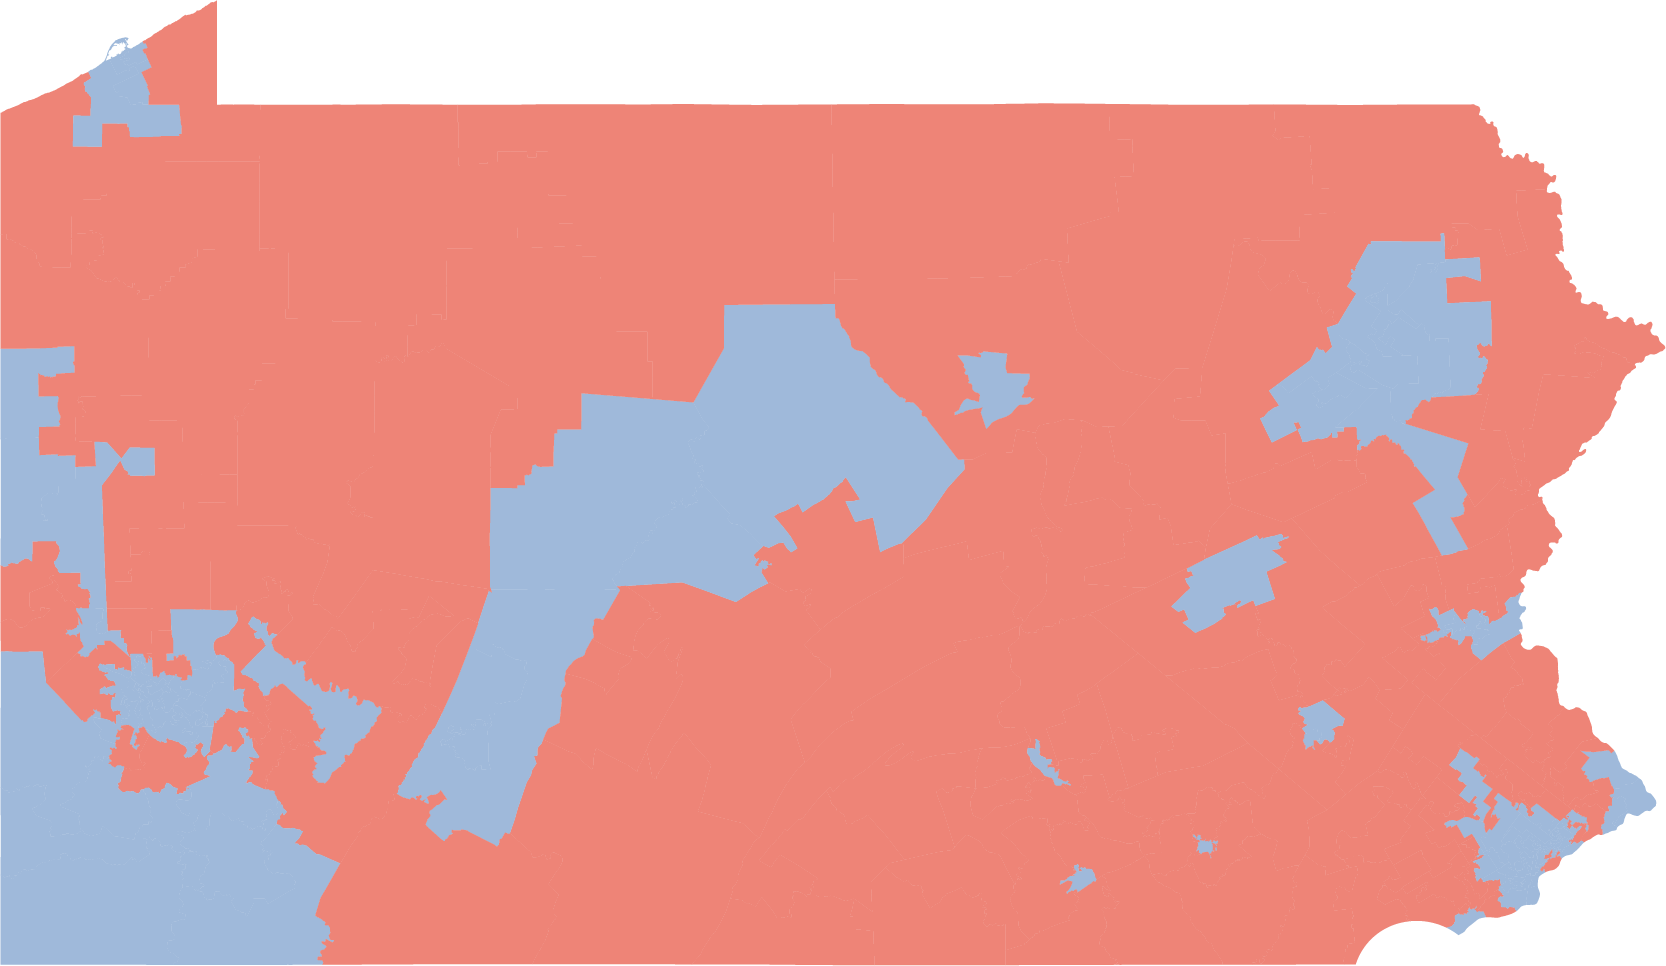
It’s clear in the U.S. House races.
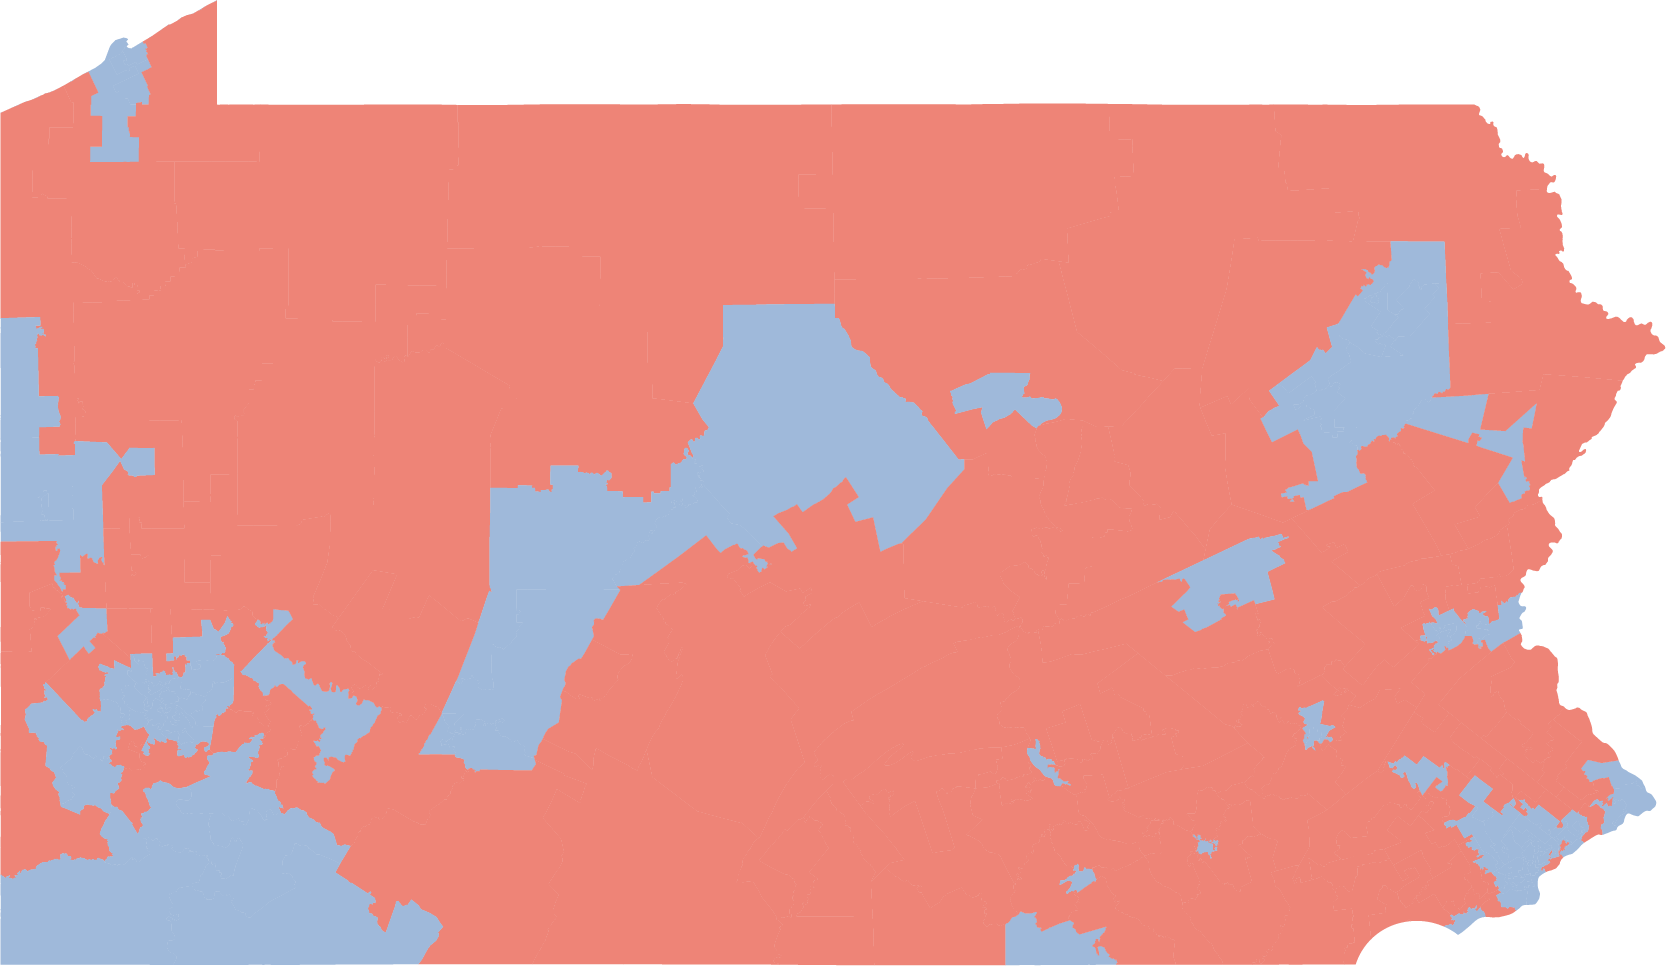
And in the governor’s race.
It hasn’t always been that way — the splitting of voters is a growing trend in Pennsylvania and the rest of the country.
But it was made particularly clear this election because of the much-discussed “blue wave” that rippled across Democratic areas…
…and the Republican counter that swept through the rural Commonwealth.
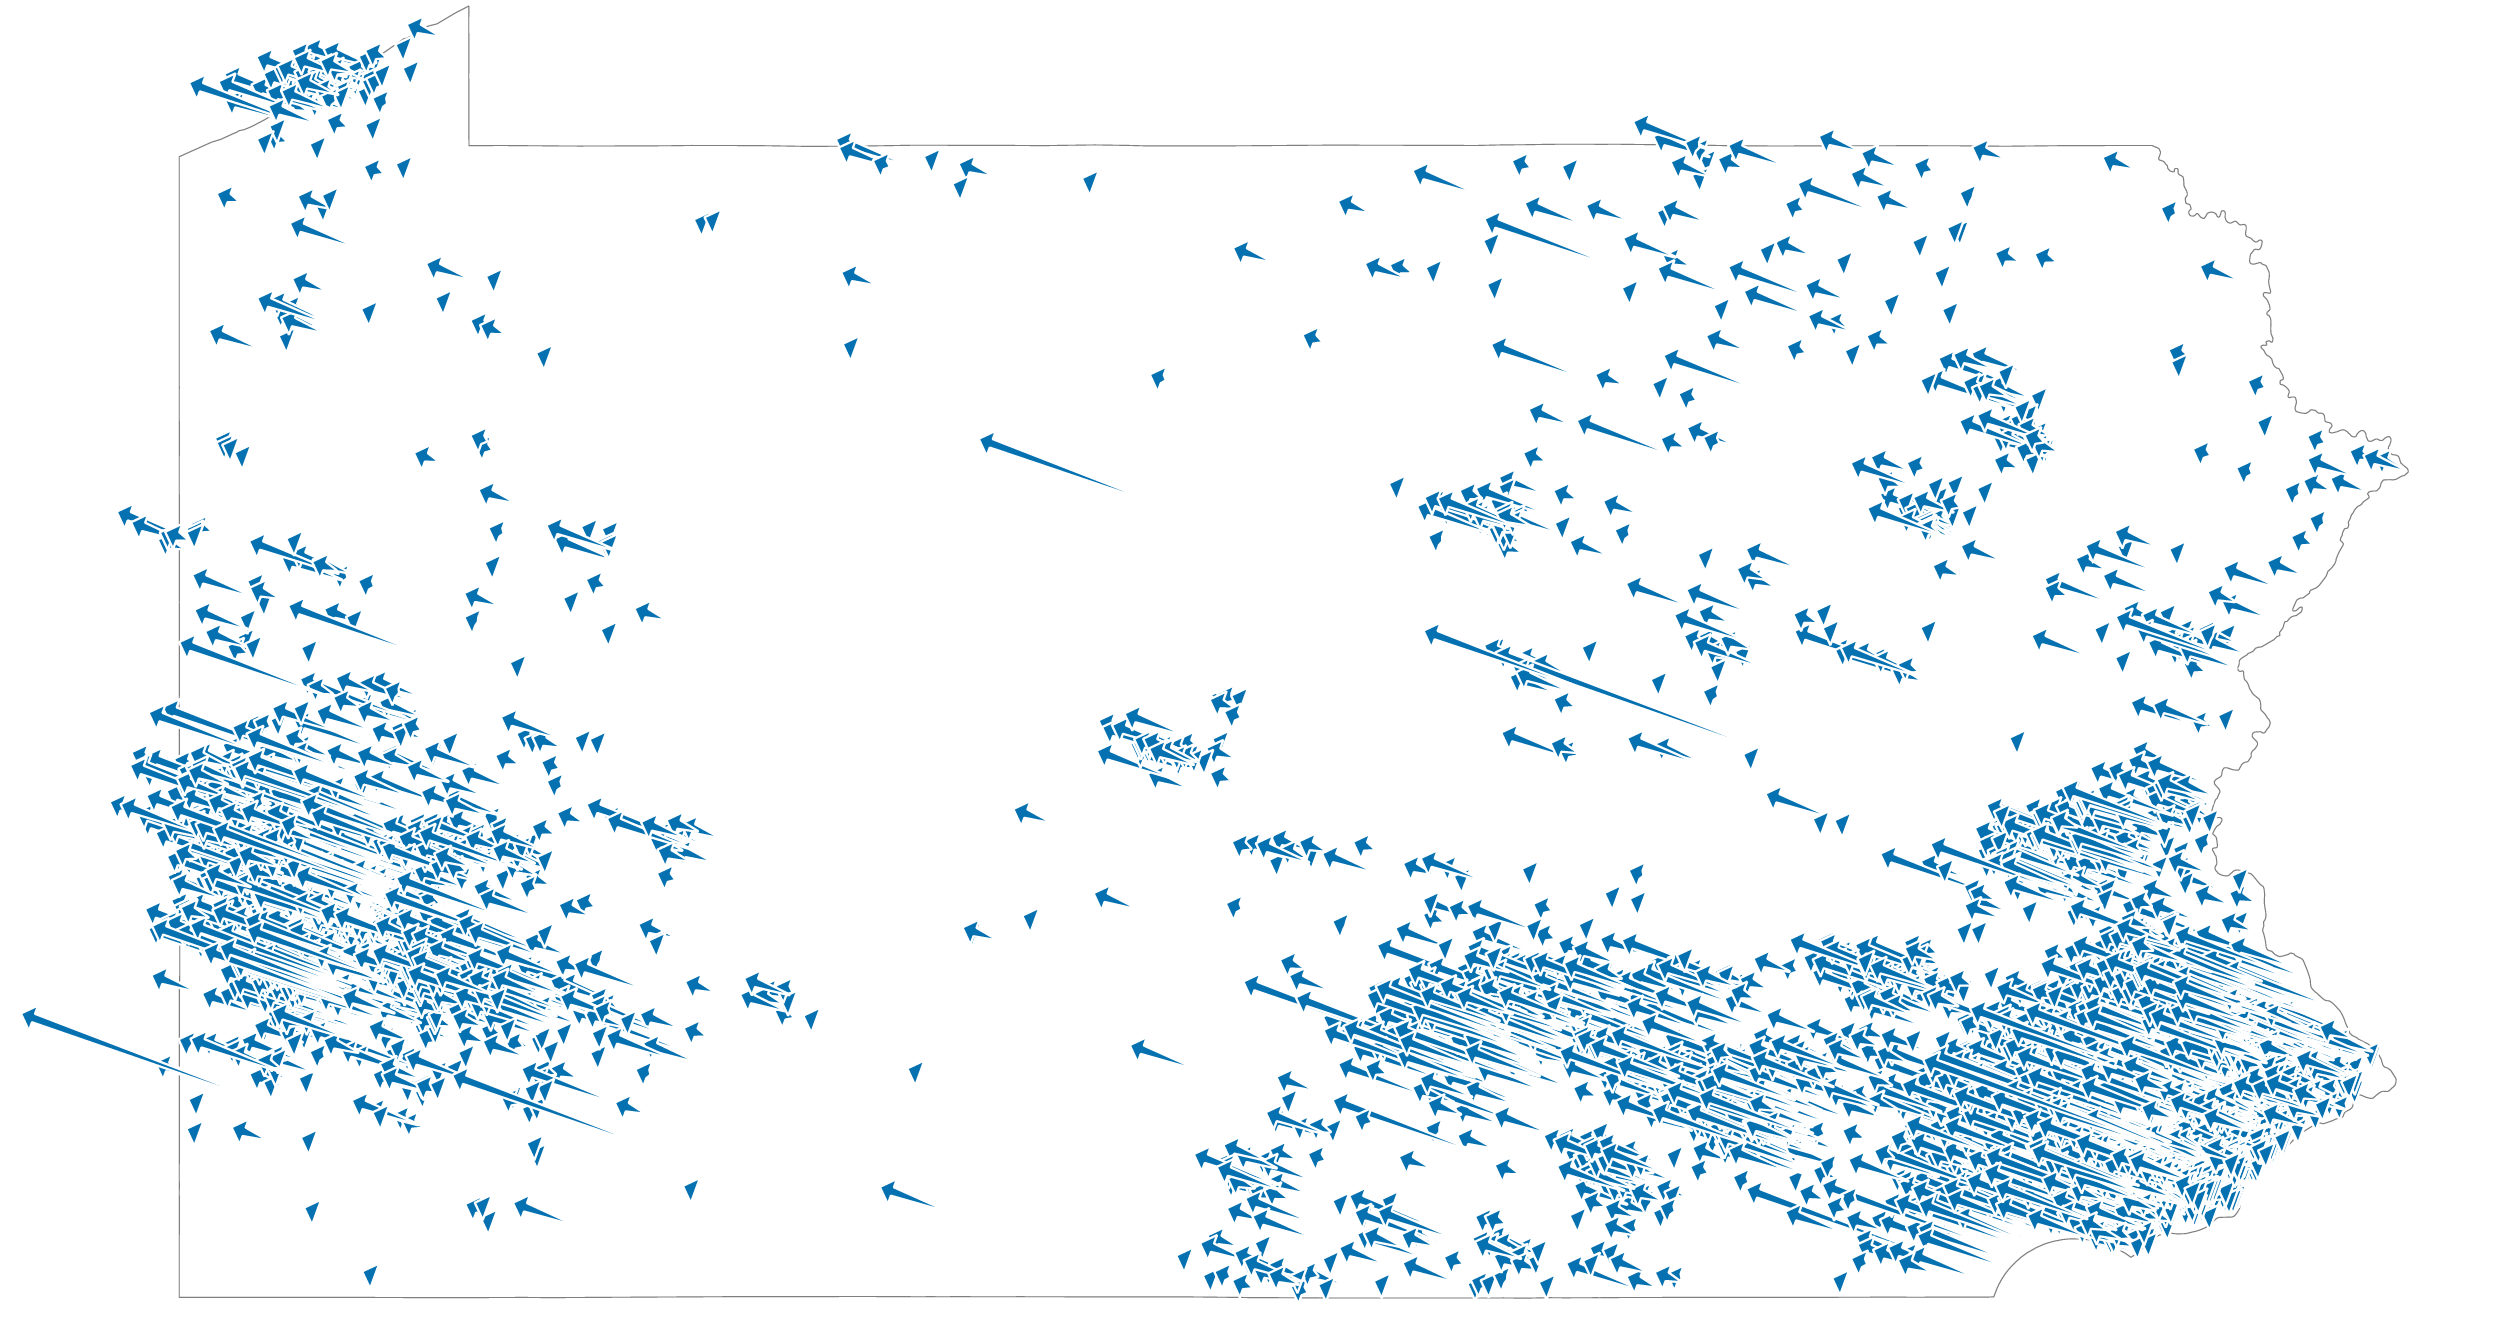
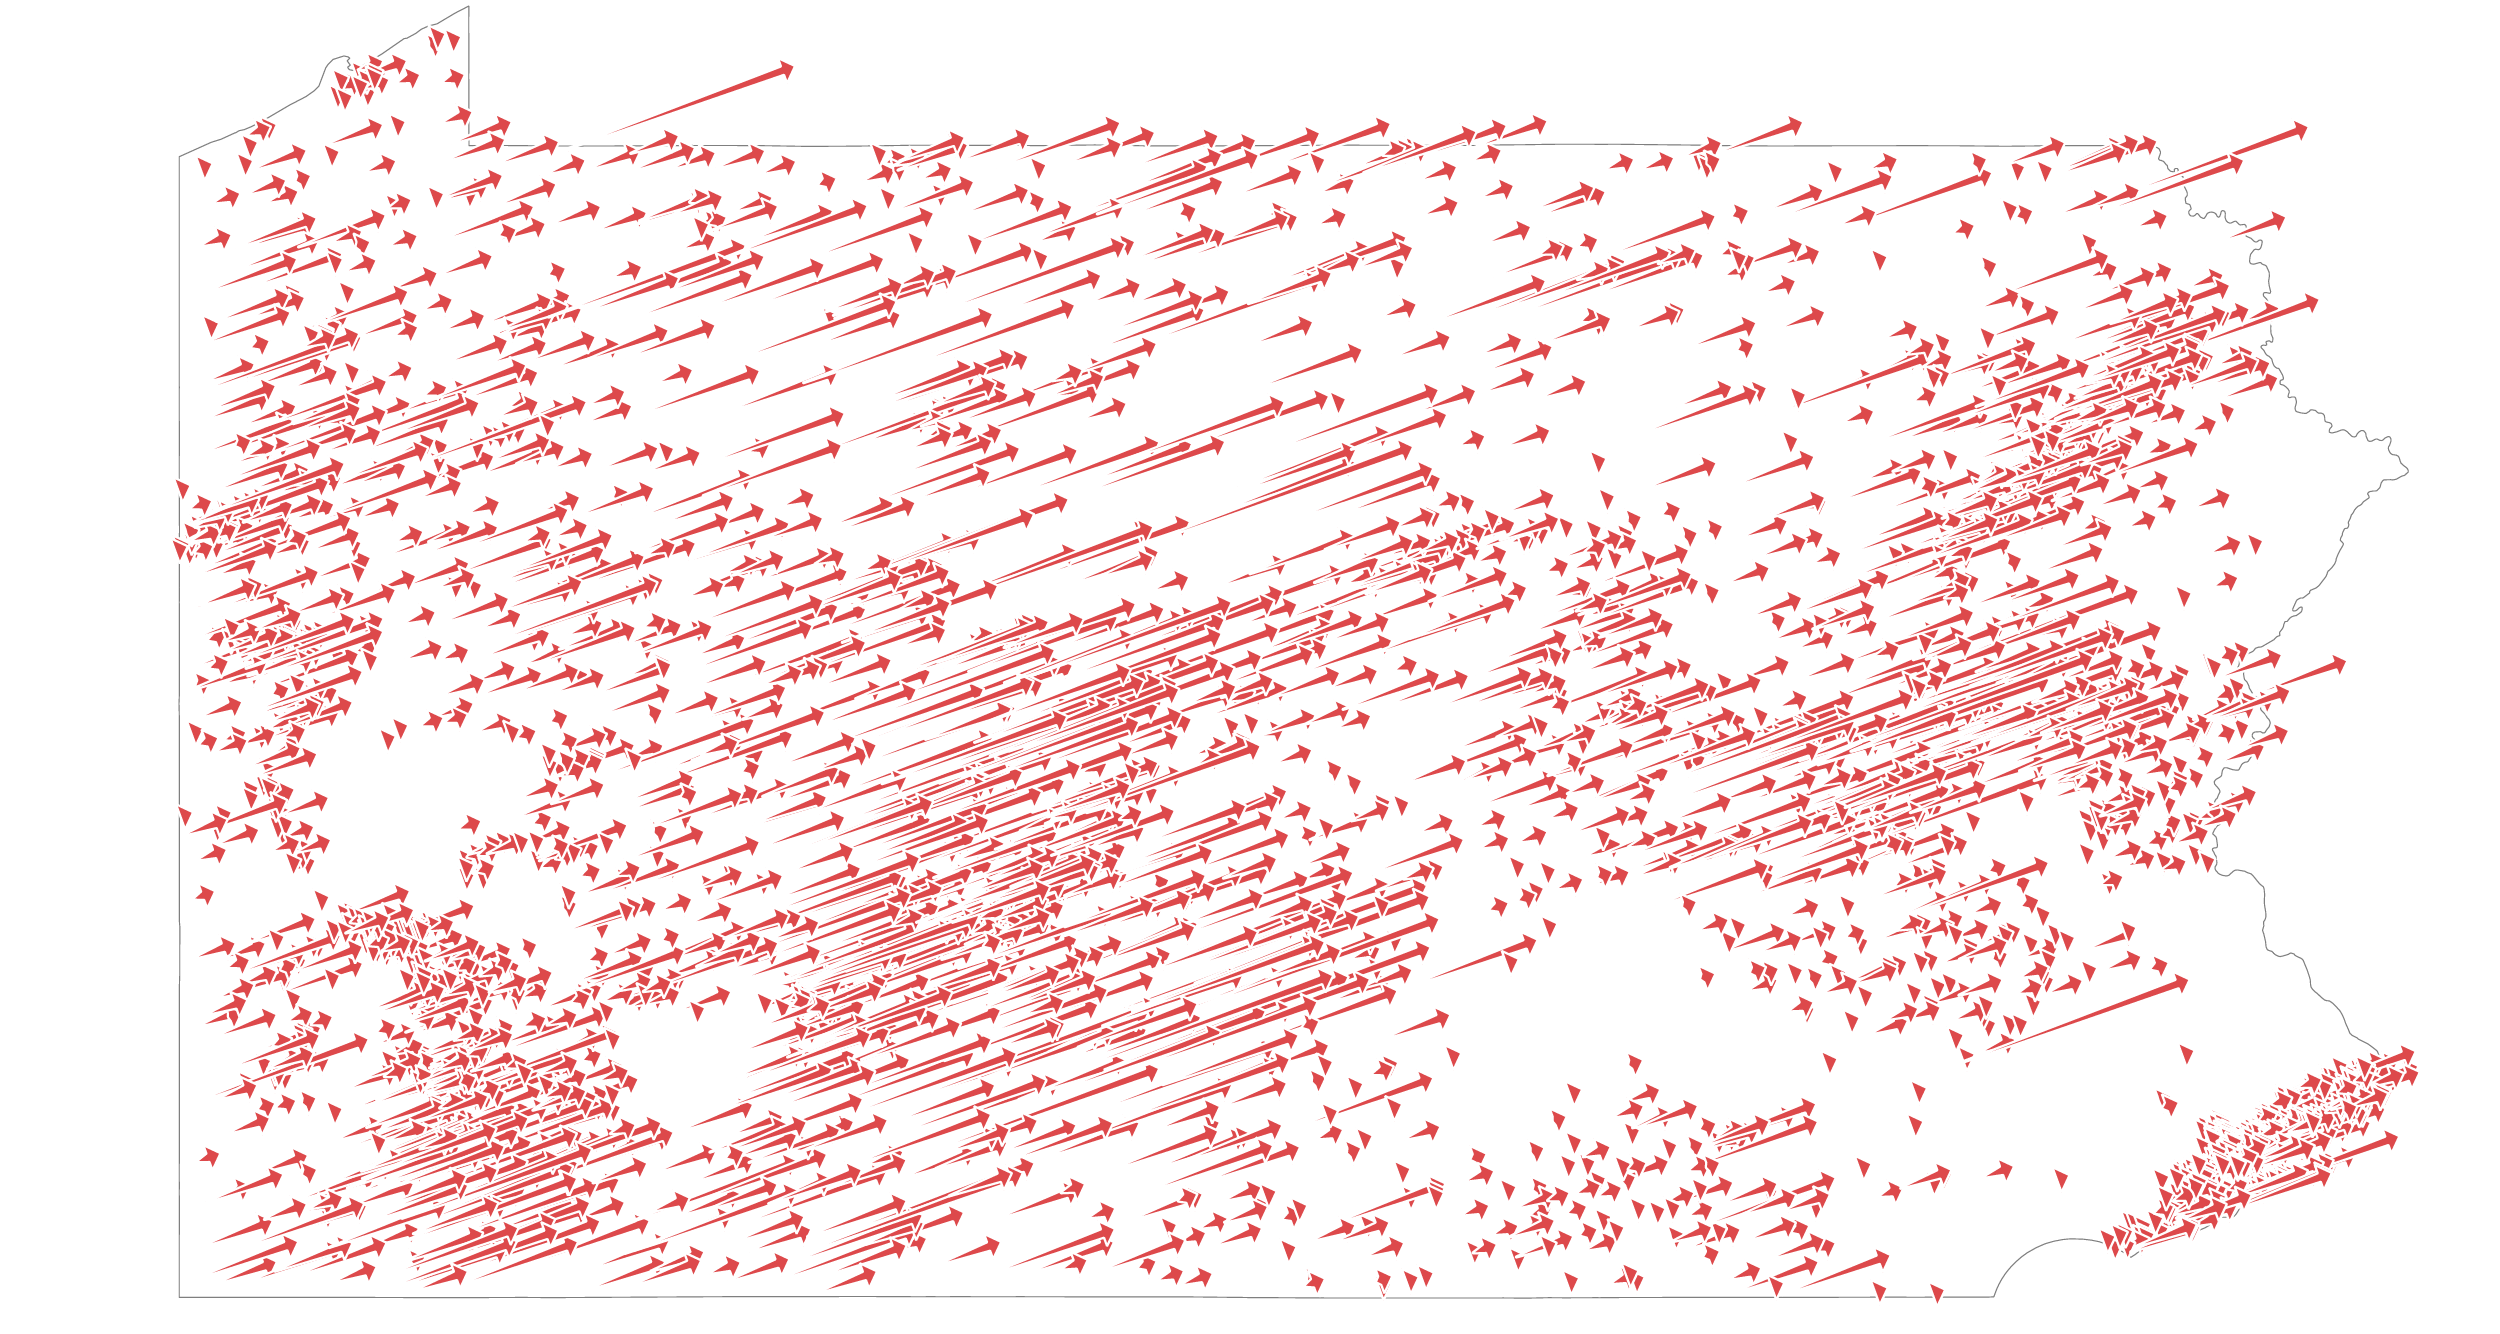
In this chart, each line represents a precinct and how it voted for governor in 2018 vs. 2014. The longer the line to the left, the more it went for Gov. Tom Wolf, the Democrat, in 2018 compared to four years prior. The longer to the right, the more it shifted Republican.
The color of each line indicates how a precinct voted: Blue for Wolf, red for Scott Wagner, the Republican.
So a red line to the left means a precinct shifted left, but ultimately voted for Wagner — just at a lower margin than it voted for former Gov. Tom Corbett, a Republican, in 2014.
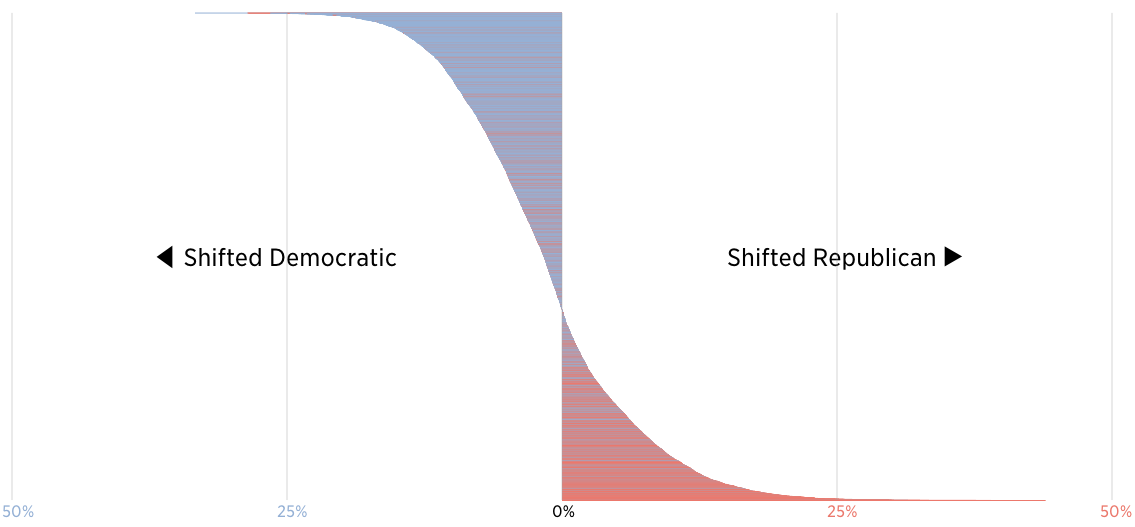
Three out of every five precincts in the state shifted to the left when comparing their votes in the 2014 and 2018 races for governor.
Nearly 5,500 precincts moved an average of 6.39 percentage points to the left, while around 3,500 precincts shifted an average of 6.38 percentage points to the right.
Overall, the state’s precincts moved 1.43 points to the left.
And it’s not true that Democrats showed up to the polls while Republicans stayed home, either — turnout was high across the entire state, including in Republican areas.
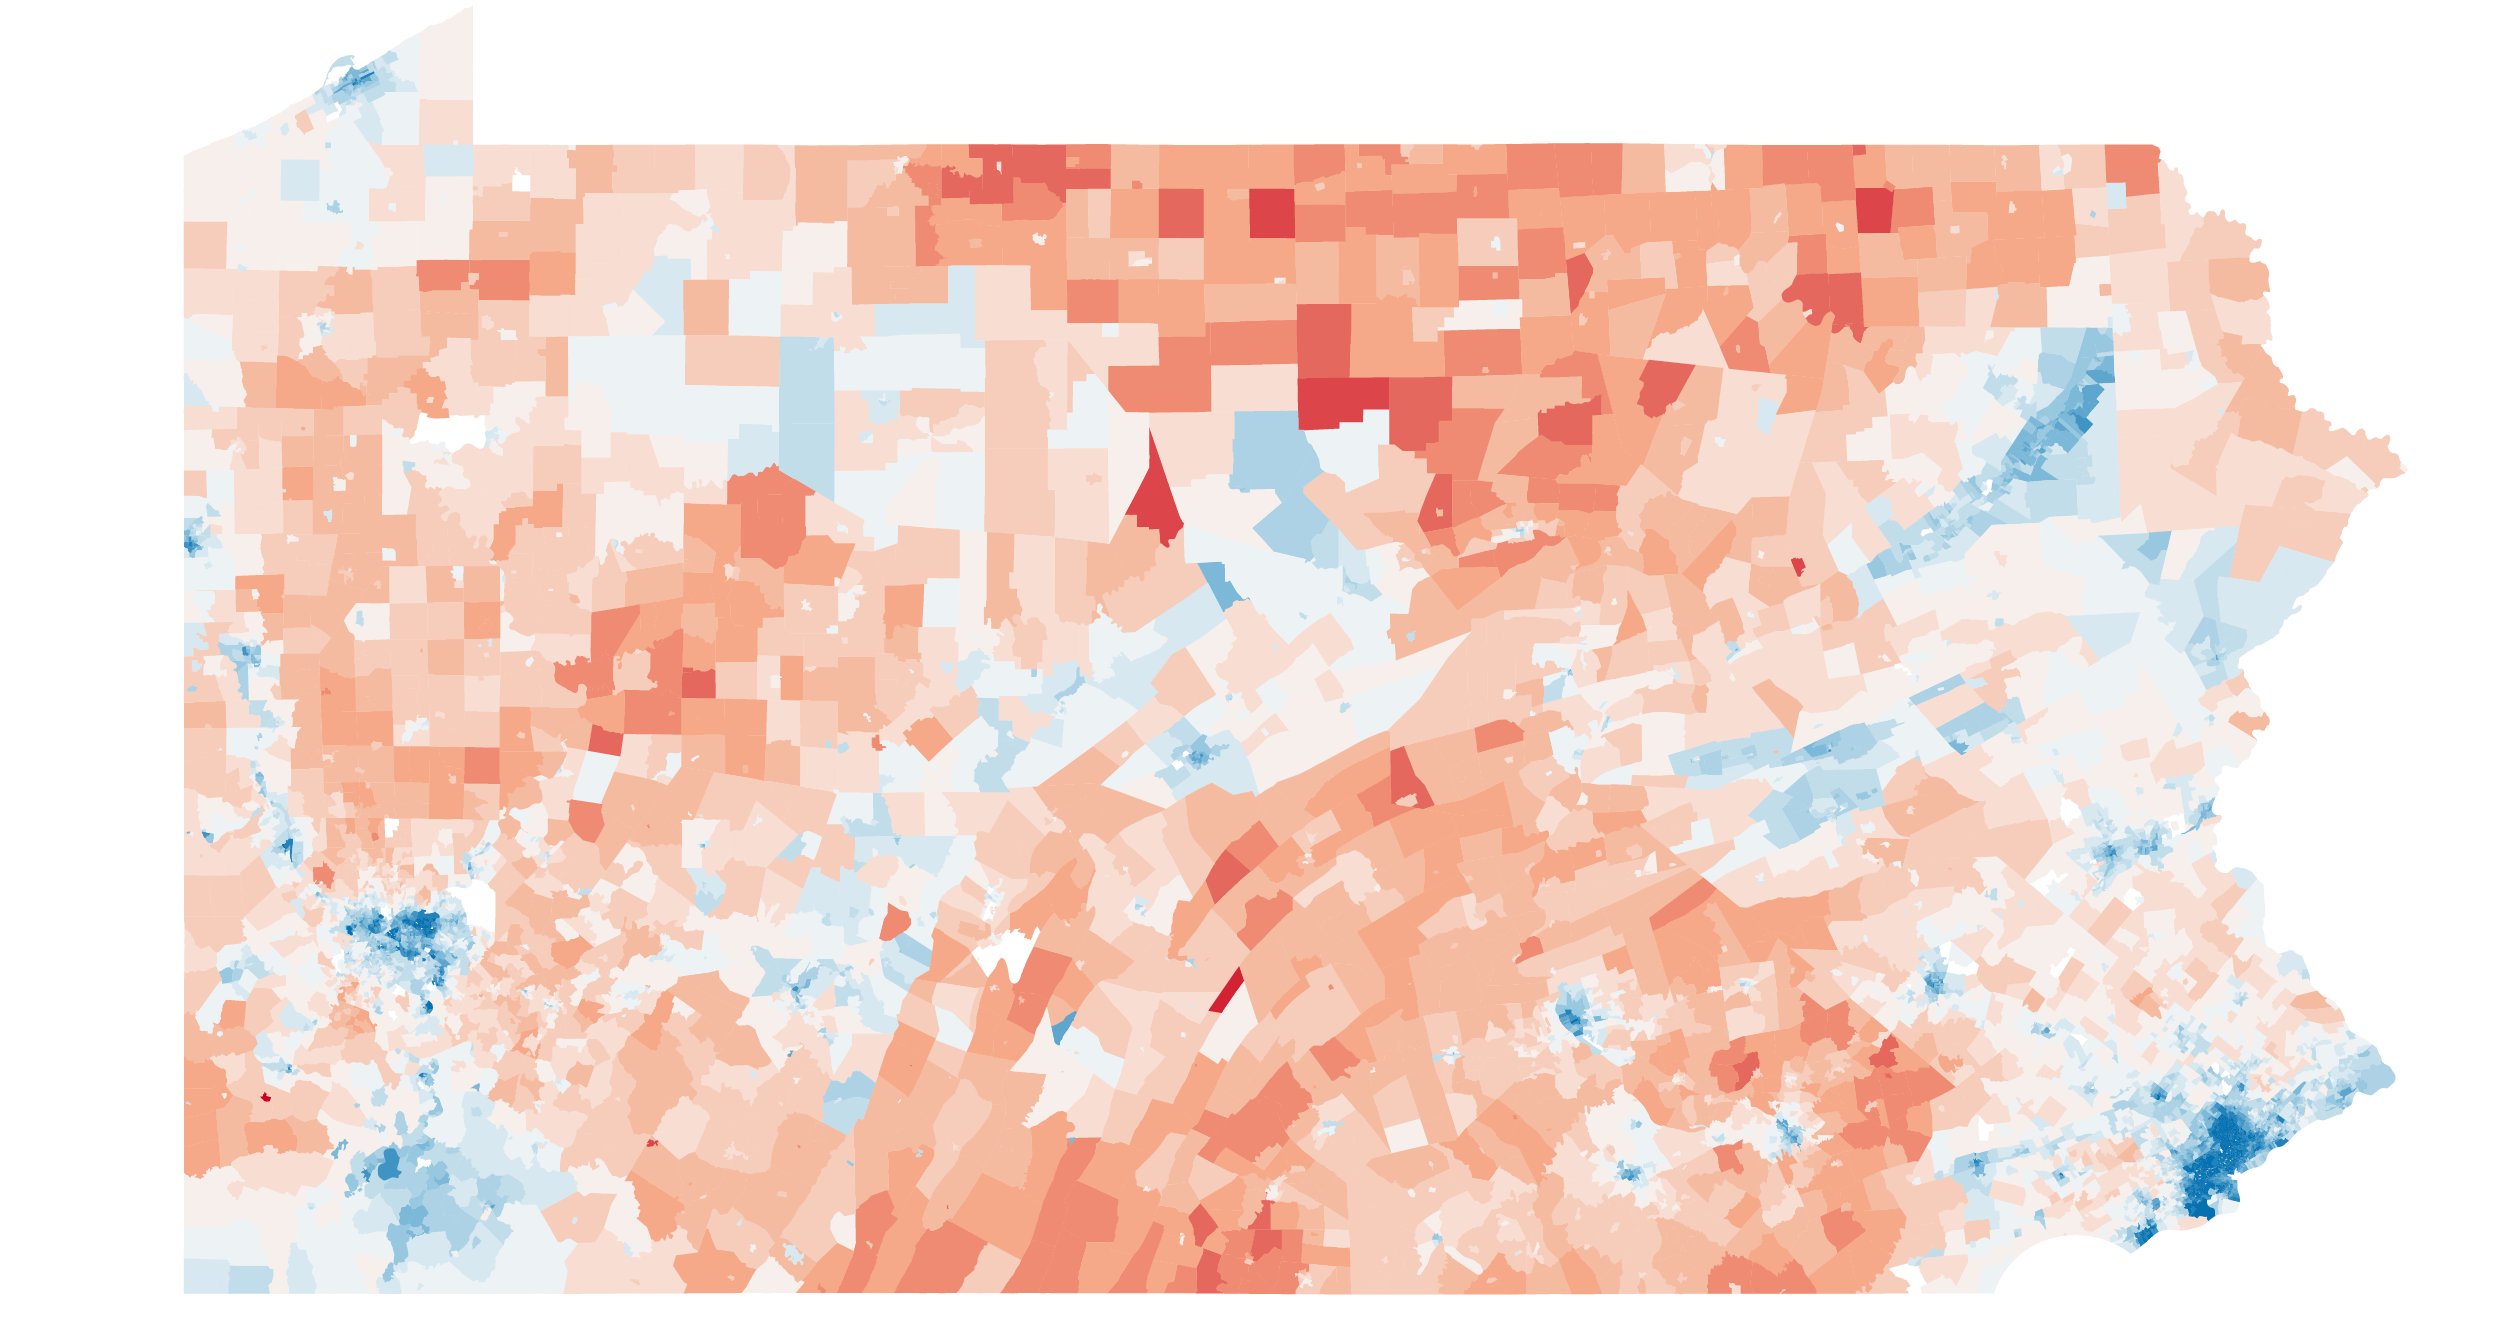
So the rural areas making up Red Pennsylvania shifted further to the right as cities cemented themselves as the anchors of Blue Pennsylvania and suburbs continued their long march to the left.
“Sometimes you think, ‘Wow, can you get more polarized?’ In some ways, the answer is yes. We’ve seen that in the last race,” said Chris Borick, a political science professor at Muhlenberg College in Allentown.
This analysis uses certified election results for the more than 9,000 precincts in Pennsylvania, providing the most complete, granular geographic picture available of official 2018 election results. A comparison with previous years reveals an ongoing division of the state, especially over the last decade.
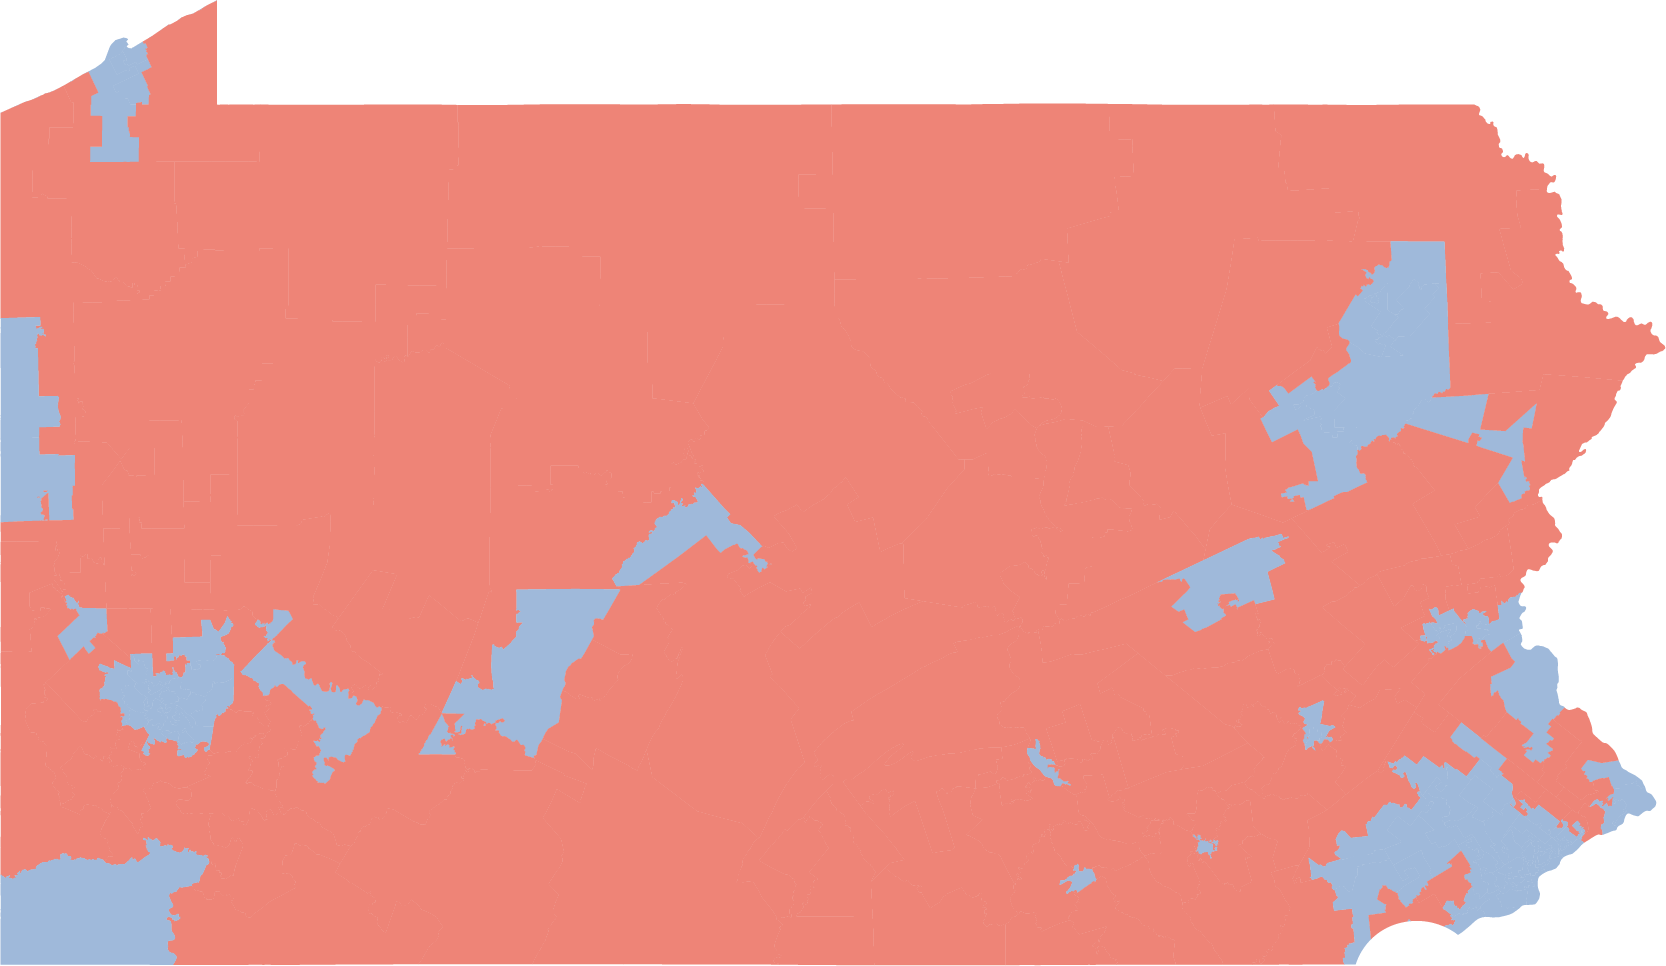
Pockets of blue have been disappearing from Central Pennsylvania, and areas that previously leaned Republican have now become solidly so.
In Southwest Pennsylvania, hemorrhaging people and jobs, a one-time Democratic stronghold has turned Republican.
In the suburbs, especially outside Philadelphia, a mix of Republican and Democratic votes have become more concretely Democratic.
Visually Comparing 2014 and 2018
“We often talk about the sorting of America, and how we tend to now congregate even more amongst those like us,” Borick said. “When I see data like this, I think it’s prime evidence of just that fact.”
That geographic sorting is a national and international trend that has profound implications for politics and governance, said William Galston, a senior fellow at the Brookings Institution whose research includes reports on geographic polarization and the Democrats’ path to victory in 2020.
“Wherever you look, the center of the populist revolt is in the small towns and rural areas,” he said. “The center of the resistance to that is in the big cities.”
In Harrisburg, lawmakers worry that middle ground is eroding beneath them as their voters push them into their respective corners. While compromise is still possible, they say, they warn of Congress-like gridlock.
And the map is increasingly perilous for Republican candidates running for higher office.
Traditionally, the path to statewide victory has run through the Philadelphia suburbs. To win the state, President Donald Trump defied the trend by winning just enough votes there and winning or closing the margins in historically Democratic areas like Northeast Pennsylvania.
But the midterm results showed possible cracks in that coalition and a return to the longer-term trend, with Democrats up and down the ballot performing well in the same counties that delivered Trump the state in 2016.
Do you find this story valuable? Support journalism at The Philadelphia Inquirer, Philadelphia Daily News and Philly.com by subscribing.
The 2018 election results suggest Trump’s 2016 victory in a handful of key states, Pennsylvania chief among them, “may well have been a one-off in response to a very particular, special set of circumstances,” Galston said.
Moving forward, said Galston and Brookings co-author Clara Hendrickson, geographic sorting and polarization make it easier and more effective than ever for politicians to focus on mobilizing their specific bases, rather than persuading swing voters.
“There’s a clear temptation now for candidates to sort of double-down on a strategy of mobilizing the geographic base, but we’re not even sure if that will work in 2020,” Hendrickson said. “And it is certainly likely to produce a legitimacy crisis within our democracy that is dangerous.”
Galston similarly warned of the dangers of deepening divisions. “If you’re only governing for one part of the country, the other part of the country is going to get really angry,” he said. It’s unclear what would slow or reverse the trend.
Blue Pennsylvania is bluer and better-defined than ever. Red-Pennsylvania is redder and better-defined than ever. And the leftward “blue wave” and its rightward counter in 2018 were a stark continuation of the long-term trend.
Consider where we were just a few years ago.
In the 2014 midterms, the suburbs were a mix of Democratic and Republican precincts. In Central Pennsylvania, there were islands of blue amid the red.
The map of results is more nuanced than the old, oversimplified idea of blue Philadelphia, blue Pittsburgh, and a Republican “T” everywhere else.
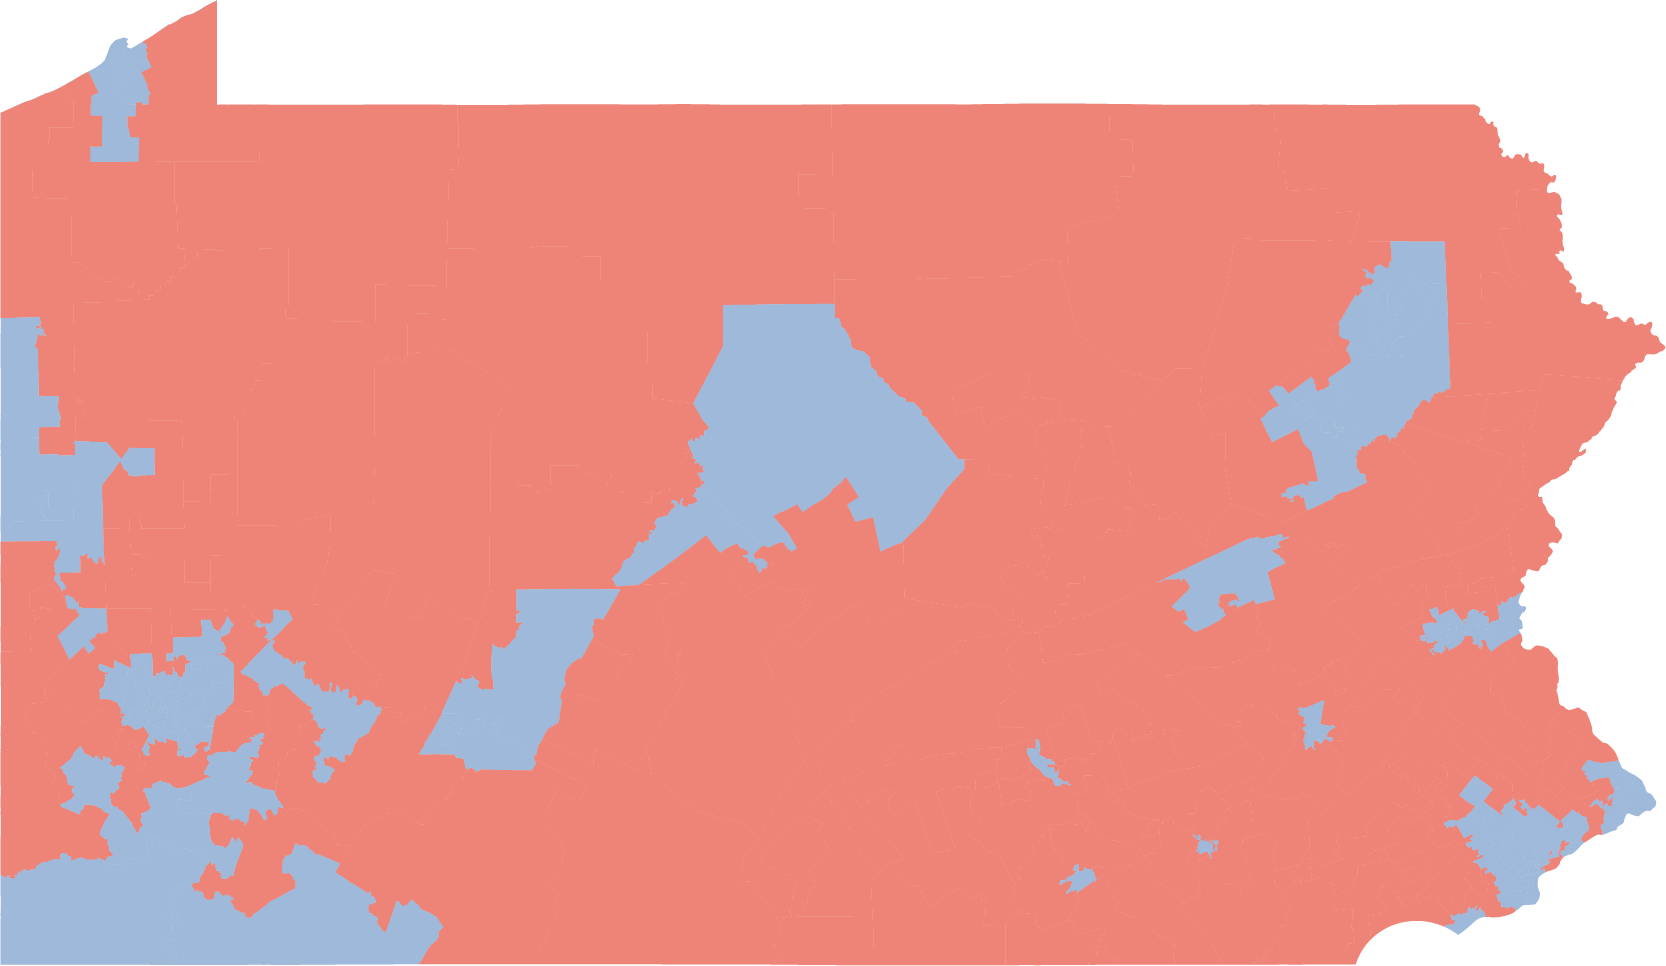
But four years later, many of those rural Democratic areas disappeared, and the suburbs were awash in blue.
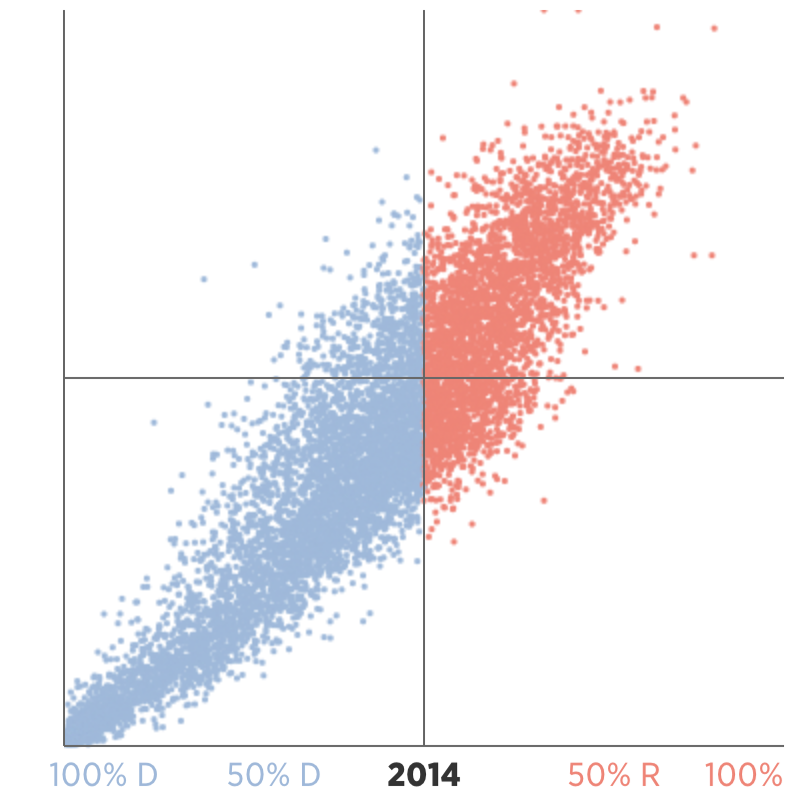
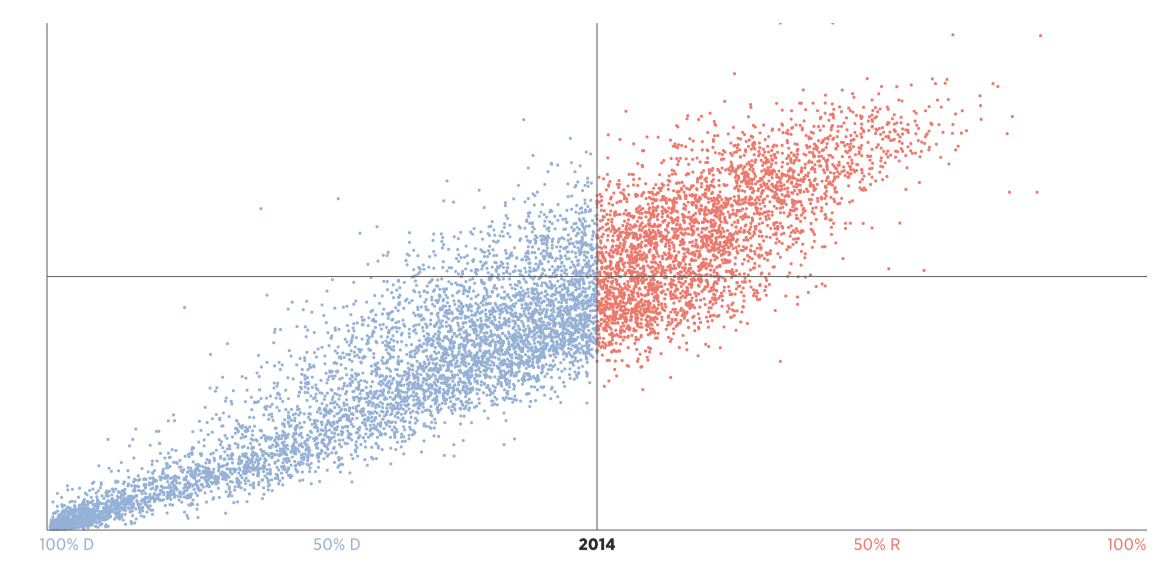
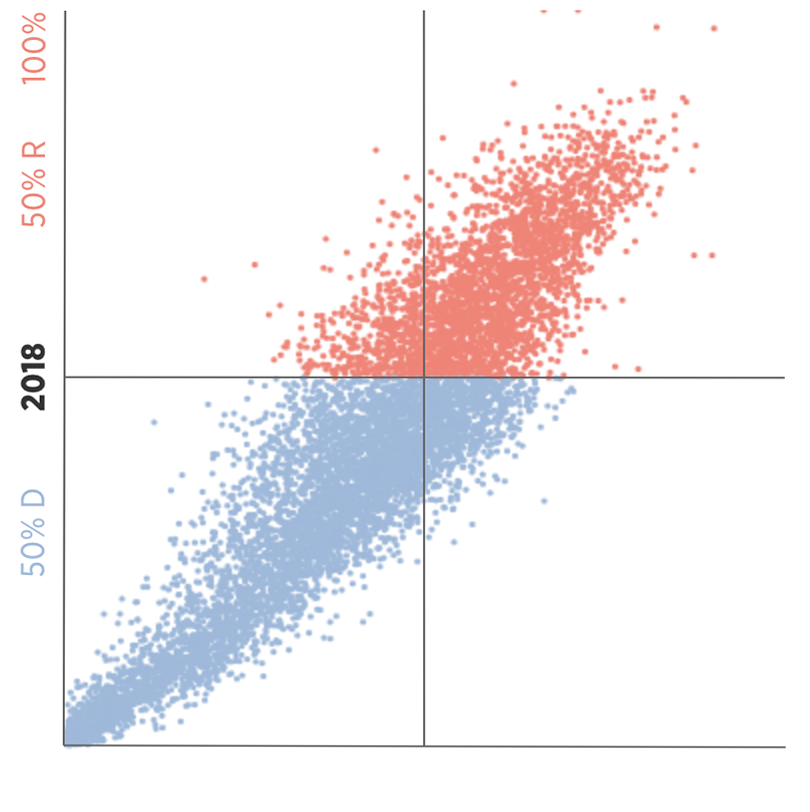
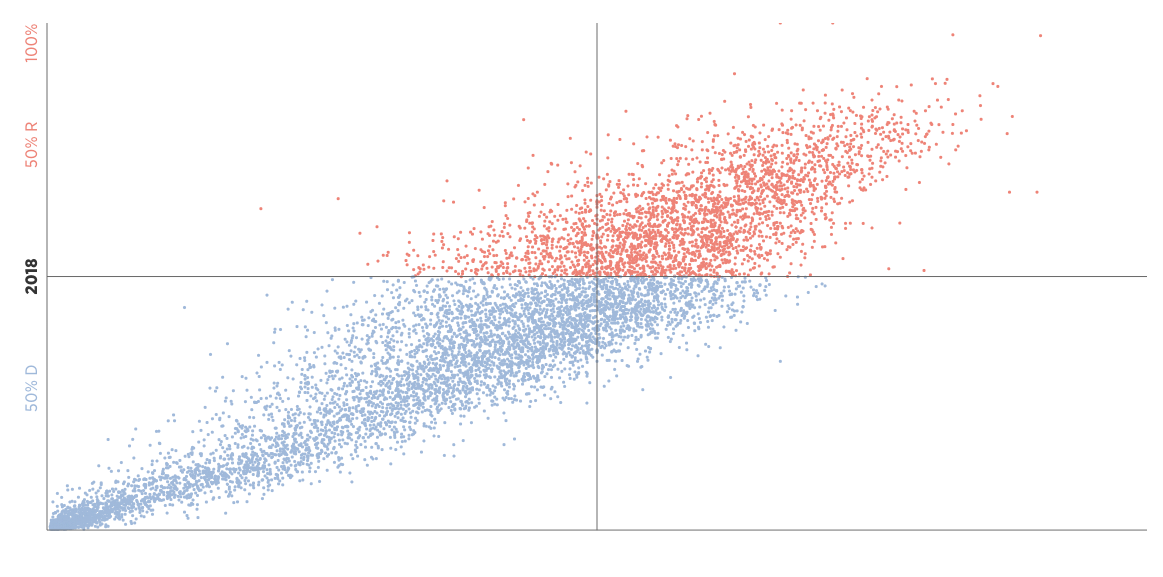
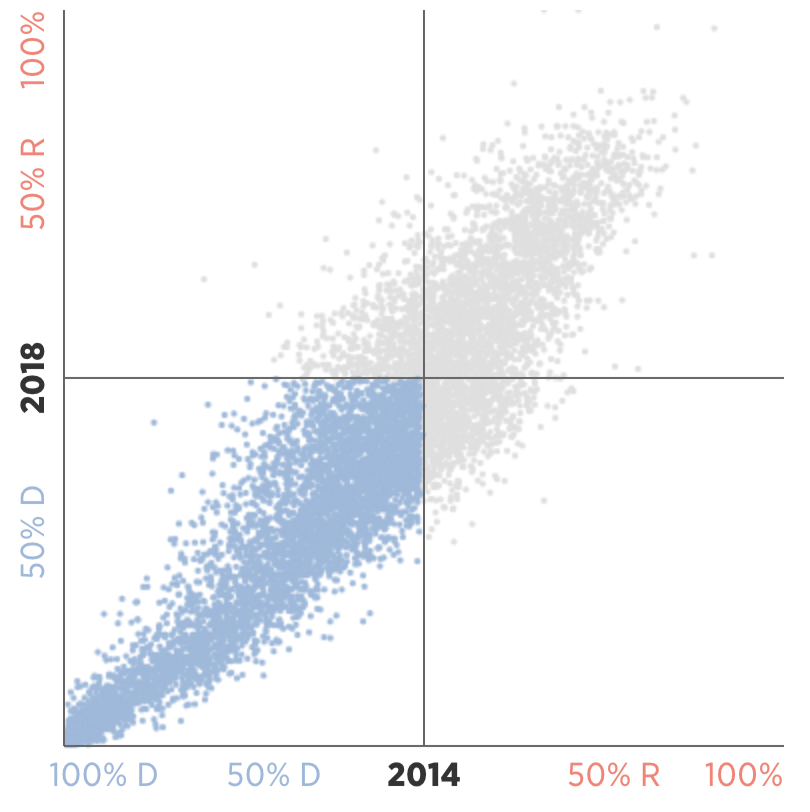
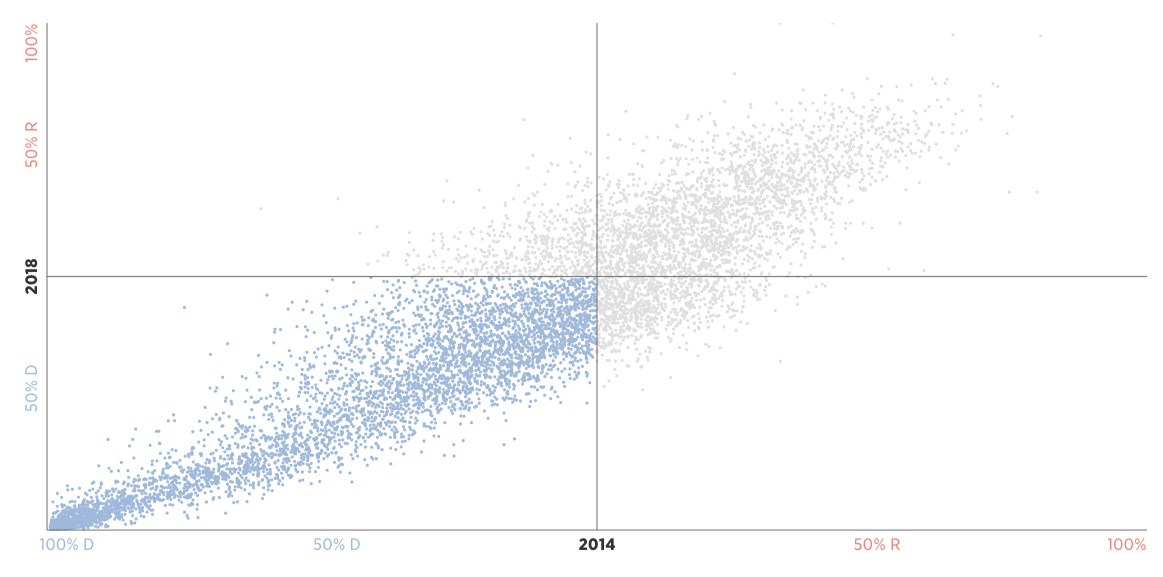
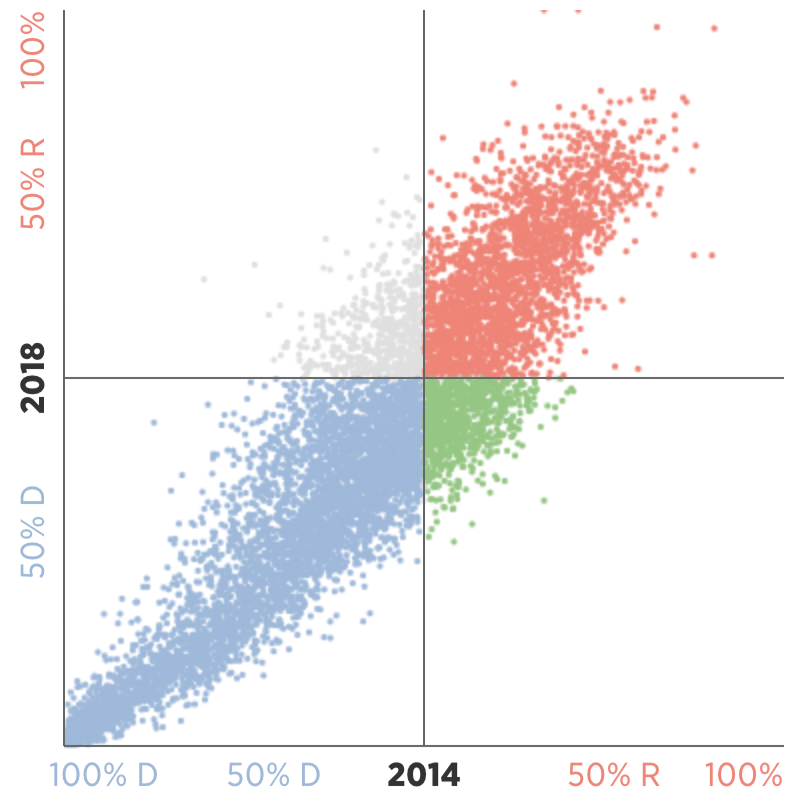
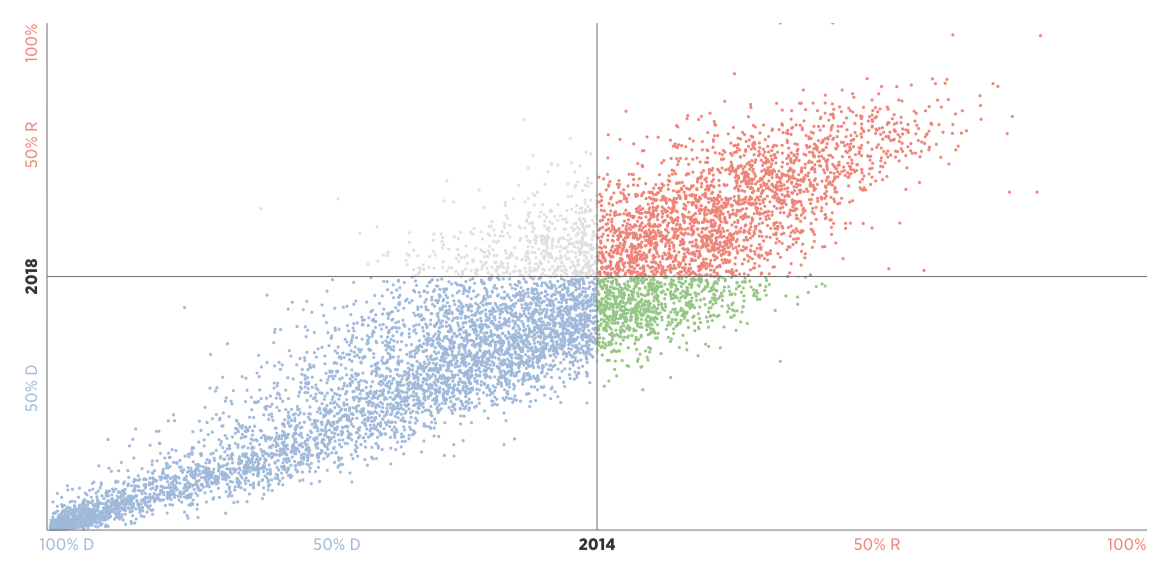
In this chart, the x-axis tells us how a precinct voted in 2014: The farther to the right, the more it voted for Corbett, the Republican, over Wolf, the Democrat.
Vertically, the y-axis tells us how each precinct voted in 2018. The higher the precinct, the more it voted Wagner over Wolf.
The biggest group is made up of more than 5,200 precincts that voted for Wolf both years.
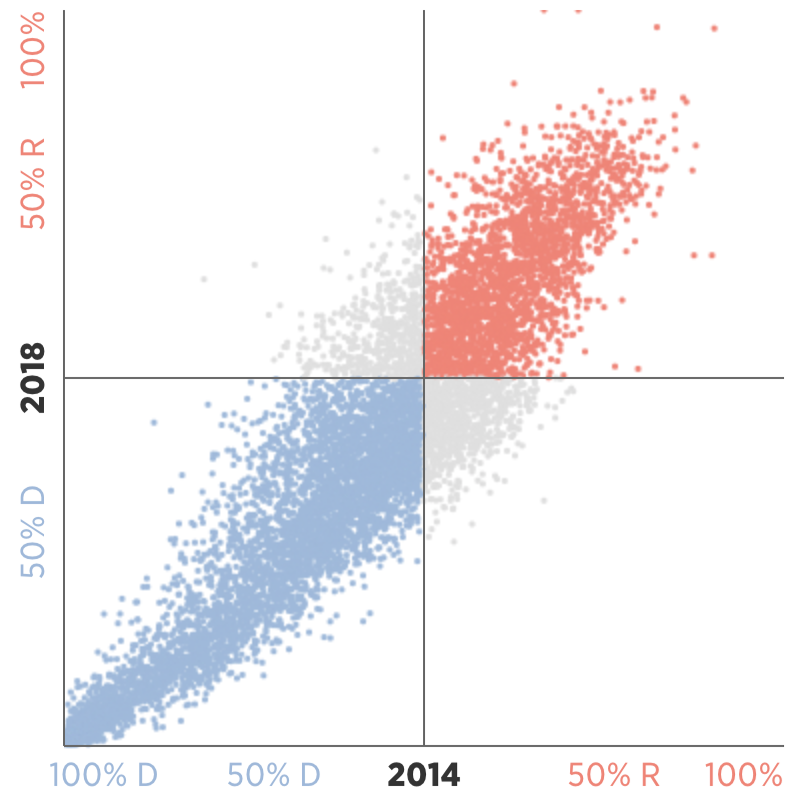
The second-largest has nearly 2,400 precincts that voted for Republicans in both elections.
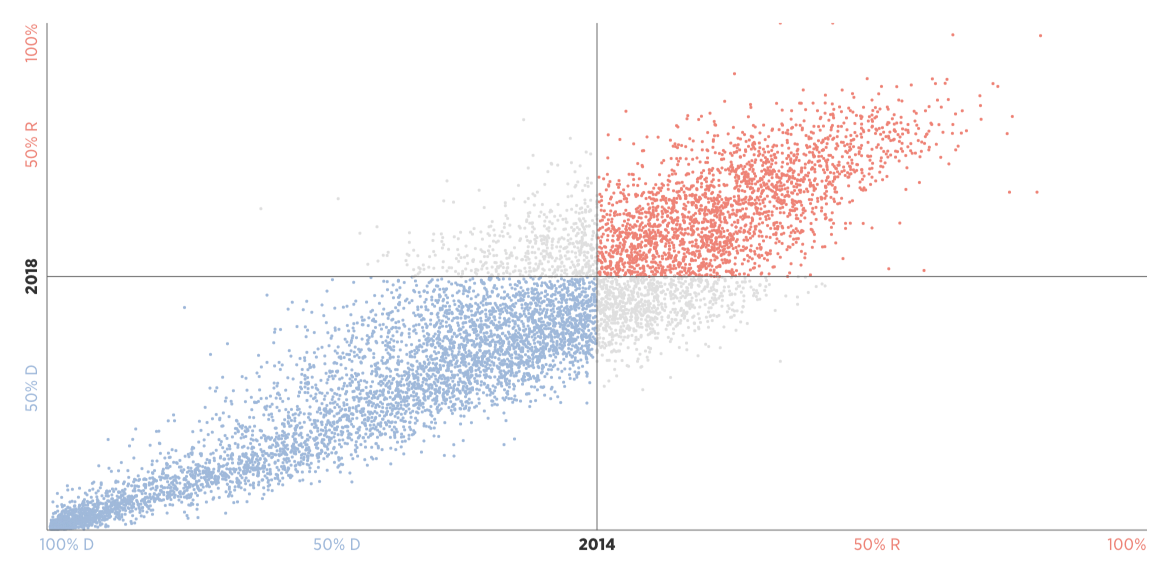
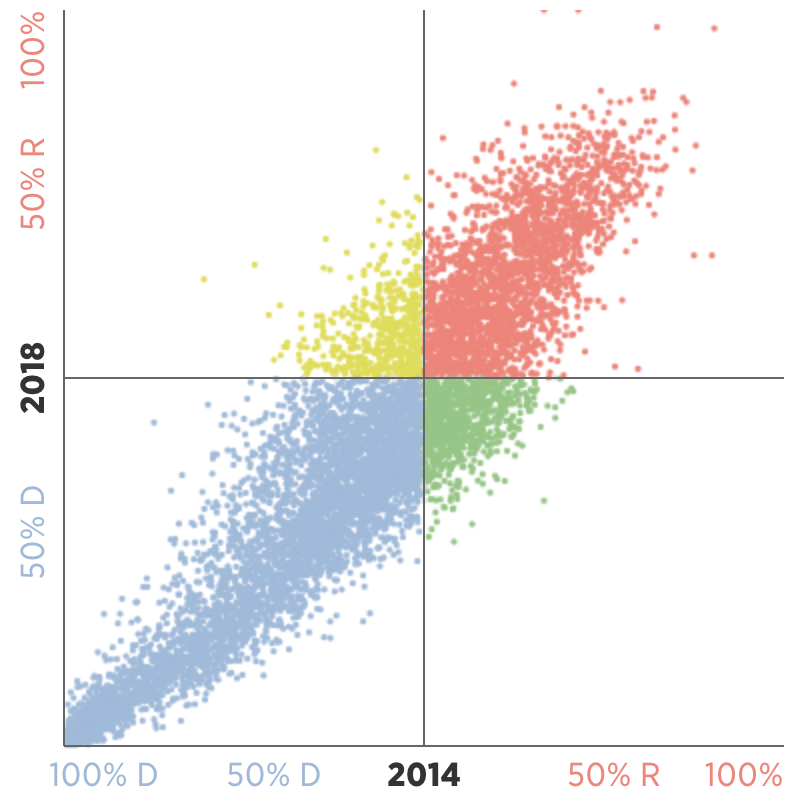
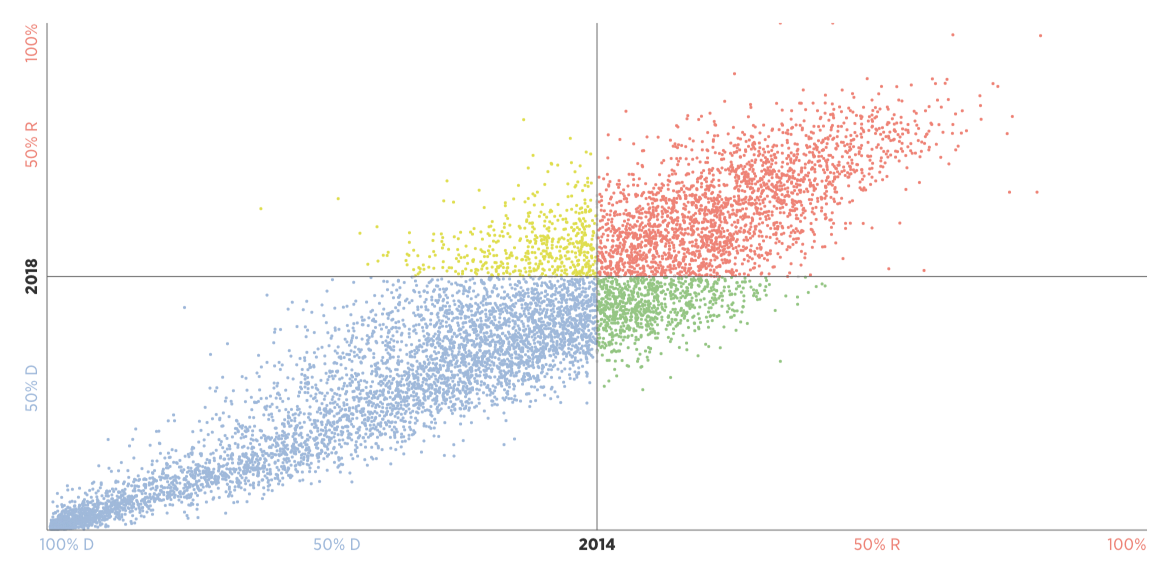
These 870 precincts shifted from voting for Corbett in 2014 to Wolf in 2018.
The more than 500 precincts in this quadrant flipped from voting for Wolf in 2014 to Wagner in 2018.
Most areas that flipped from Corbett to Wolf are in the suburbs of urban, Democratic areas, while the ones that flipped from Wolf to Wagner are more rural, surrounded by other Republican precincts.
As those trends continue, legislative leaders have publicly expressed concern about increasing polarization and its implications for governance, warning Harrisburg could become entrenched in gridlock.
Newly minted House Majority Leader Bryan Cutler, a Republican state representative from Lancaster County, said he’s seen a shift since he arrived in 2007.
It was just over a decade ago, but back then, he said, there were lawmakers who “held seats that politically on paper they never should, whether it’s Democrats in rural areas or Republicans in urban areas.”
State House wins, 2008 to 2018
That’s disappearing, Cutler said, and at the time he’s seeing fewer lawmakers in the middle of the ideological spectrum, more of them at either end.
“Now I kind of refer to it as more of a dumbbell,” he said. “It’s gotten heavy on both ends.”
Still, Cutler said, lawmakers have to be able to find some common ground if they’re going to get anything done.
After all, Republicans may control the state House and Senate for now, but Wolf has veto power over any legislation they pass. And with Democrats gaining, who knows how long Republican control will last?
State Sen. Jake Corman (R., Centre), the Senate Majority Leader, agreed with Cutler that finding compromise with Democrats is critical.
That’s become more difficult as candidates who are willing to compromise are defeated in primary elections, he said, but he expressed confidence in lawmakers’ willingness to meet in the middle.
“You just have to be willing to take on your base, so to speak, if that’s appropriate,” he said.
Corman said several of his biggest recent legislative achievements have come through compromise, citing pension reform and medical marijuana laws.
“The key is you have to be willing to give,” Corman said. “Everyone wants to get, everyone wants what they want. You have to be willing to give, and that’s how you build compromise.”
Correction: An earlier version of one map incorrectly displayed 2014 gubernatorial results for Montour County in place of 2018 data, which in fact was not provided by the state.
Staff writer Andrew Seidman contributed to this article.
Sources: The 2018 precinct-level election data and state House results came from the Pennsylvania Department of State. The 2014 precinct-level election data came from the OpenElections Project. Precinct mapping files came from Nathan Kelso and Michal Migurski.
Please click here to read this special report in full.